










Sandur Q2 PAT rose 88% as consolidated margins expanded
Key highlights
- Sandur reported Q2FY27 consolidated PAT of Rs 261 crore, up 88% year on year.
- Sandur’s Q2FY27 consolidated EBITDA was Rs 391 crore, up 37% year on year, with a 26% margin.
- Sandur’s Q2FY27 iron ore sales were 12.45 lakh tonnes, up 59% year on year.
- Sandur reported consolidated cash and cash equivalents of Rs 630 crore at Q2FY27.
powered by IRIS
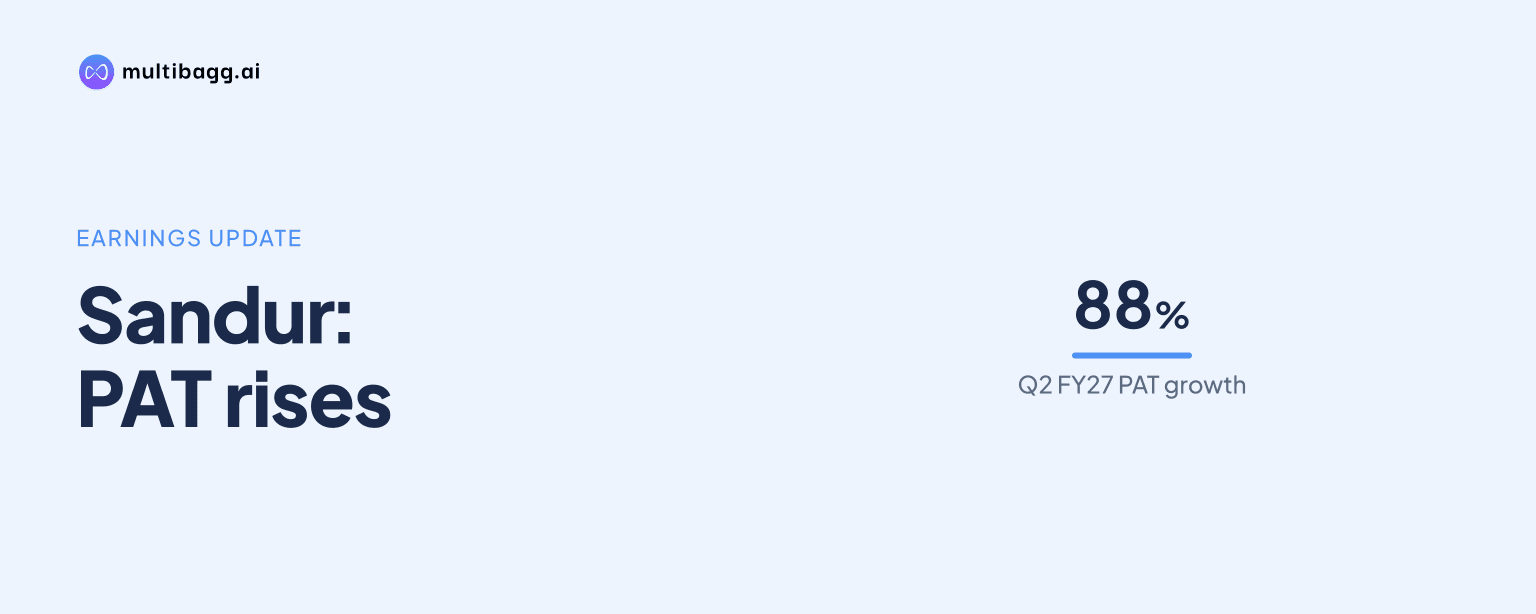
The Sandur Manganese & Iron Ores Limited reported consolidated profit after tax of Rs 261 crore in Q2FY27, up 88% year on year, as total income increased 22% to Rs 1,519 crore and EBITDA margin expanded 2.8 percentage points to 26%. Q2FY27 ended on 30 September 2026.
Know Sandur Manganese & Iron Ores inside out
Results, valuation, peers and who's buying, in one view.
How did Sandur’s consolidated earnings change in Q2FY27?
Sandur’s consolidated earnings grew faster than total income in Q2FY27. Earnings before interest, tax, depreciation and amortisation (EBITDA) rose 37% year on year to Rs 391 crore, while profit after tax (PAT) rose 88% to Rs 261 crore. Total income was Rs 1,519 crore, up 22% from Q2FY26 and 9% from Q1FY27; EBITDA rose 9% sequentially and PAT increased 15%.
The higher rate of profit growth coincided with reported margin expansion. Consolidated EBITDA margin was 26% in Q2FY27, 2.8 percentage points above Q2FY26, while PAT margin was 17%, up 6.0 percentage points. Sandur also reported consolidated shareholders’ funds of Rs 3,716 crore and gross debt-to-equity of 0.24 times for the quarter.
What does Sandur’s first-half performance show?
Sandur reported consolidated total income of Rs 2,909 crore for H1FY27, the first half of FY27, up 21% year on year. EBITDA was Rs 749 crore, up 25%, and PAT was Rs 489 crore, up 60%. The six-month figures therefore also show PAT increasing more quickly than total income.
Consolidated EBITDA margin for H1FY27 was 26%, a 0.7 percentage-point year-on-year expansion, while PAT margin was 17%, up 4.0 percentage points. Q2FY27 alone recorded larger expansions of 2.8 percentage points in EBITDA margin and 6.0 percentage points in PAT margin. The comparison shows that the reported second-quarter improvement exceeded the margin change shown for the first half as a whole.
How did Sandur’s standalone results compare with consolidated results?
Sandur’s standalone Q2FY27 total income was Rs 593 crore, EBITDA was Rs 263 crore and PAT was Rs 178 crore. These figures represented year-on-year growth of 33%, 35% and 62%, respectively. Standalone EBITDA margin was 44% and PAT margin was 30%, compared with consolidated margins of 26% and 17%.
The presentation also shows different capital measures for the two reporting bases. Standalone shareholders’ funds were Rs 3,422 crore and gross debt-to-equity was 0.08 times, versus consolidated shareholders’ funds of Rs 3,716 crore and gross debt-to-equity of 0.24 times. For H1FY27, standalone total income was Rs 1,147 crore, EBITDA was Rs 500 crore and PAT was Rs 339 crore, with PAT up 42% year on year.
Got a follow-up? Ask IRIS
Which Sandur operating segments changed most in Q2FY27?
Sandur’s iron ore operation posted the largest disclosed sales-volume increase in Q2FY27. Sales were 12.45 lakh tonnes, up 59% year on year and 29% quarter on quarter, while production was 11.63 lakh tonnes. Average iron ore realisation was Rs 2,975 per tonne, down 4% from Q1FY27.
Manganese ore sales were 0.79 lakh tonnes, down 3% year on year and 19% sequentially, although average realisation rose 7% from Q1FY27 to Rs 8,502 per tonne. Manganese ore production was 1.36 lakh tonnes, compared with 1.50 lakh tonnes in Q1FY27 and 1.28 lakh tonnes in Q2FY26. This contrasts with iron ore, where sales volumes rose while sequential realisation declined.
Steel sales increased 11% year on year and 7% quarter on quarter to 1.12 lakh tonnes, with average realisation increasing 5% sequentially to Rs 78,422 per tonne. Ferroalloy sales declined 5% year on year and 18% sequentially to 13,429 tonnes, while realisation declined 1% from Q1FY27 to Rs 70,515 per tonne. Steel production was 1.09 lakh tonnes, while ferroalloy production was 14,142 tonnes.
Coke sales were 935 tonnes, down 80% year on year and 56% quarter on quarter, and the presentation attributes the volume reduction to volumes under a conversion contract. Coke production was recorded as zero, excluding 58,984 tonnes produced under contract manufacturing. Its disclosed Rs 10.91 crore of conversion and screening income was also excluded from the coke realisation figure of Rs 28,967 per tonne.
What do Sandur’s debt and cash figures show?
Sandur reported standalone cash and cash equivalents of Rs 608 crore and consolidated cash and cash equivalents of Rs 630 crore at Q2FY27. The presentation lists consolidated debt-to-equity at 0.24 times and standalone debt-to-equity at 0.08 times. It also lists A+ ratings from CRISIL and ICRA for the cited term loans and cash-credit facilities.
The standalone debt movement slide records a Rs 1,309 crore net-debt increase in FY25, used mainly to finance the Royal Sandur Metals acquisition. It then records net-debt decreases of Rs 583 crore in FY26 and Rs 247 crore in H1FY27, generated through Sandur’s core cash flows. The presentation further says non-convertible debentures issued in FY25 were repaid early in FY26 through cash generation from the core business.
Conclusion
Sandur’s Q2FY27 figures show consolidated PAT growth of 88% outpacing the 22% increase in total income, alongside a 2.8-percentage-point rise in EBITDA margin and a 6.0-percentage-point increase in PAT margin. Iron ore sales rose 59% year on year to 12.45 lakh tonnes and steel sales increased 11% to 1.12 lakh tonnes, while manganese ore and ferroalloy sales volumes declined.
The presentation provides no FY27 income, profit or volume target, leaving the durability of the quarterly margin expansion unresolved. Future results will show whether higher manganese ore and steel realisations, iron ore volume growth and the disclosed coke conversion-contract activity, including 58,984 tonnes of contract-manufacturing production in Q2FY27, continue to affect reported performance.