










SC Agrotech models Rs 1,000 crore FY30 GMV, not guidance
Key highlights
- SC Agrotech’s FY30 illustration uses Rs 1,000 crore of GMV and Rs 52 crore of revenue at a 5.2% monetisation rate.
- The model moves from Rs 125 crore of GMV in FY28 to Rs 500 crore in FY29 and Rs 1,000 crore in FY30.
- The Rs 100 crore hypothetical capital case shows Rs 18 crore of EBITDA and Rs 12.1 crore of PAT at a 5.2% take rate.
- SC Agrotech states that no realised AgriBridge GMV, revenue, earnings or approved capital commitment is claimed.
powered by IRIS
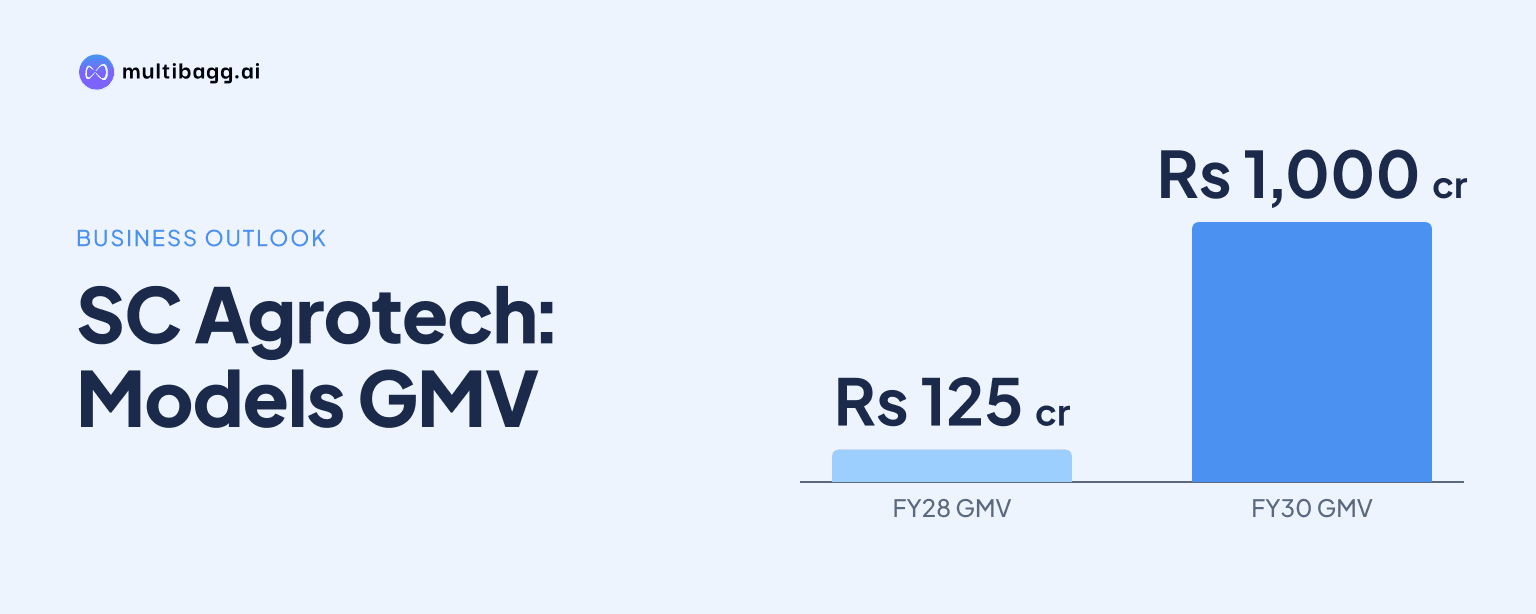
SC Agrotech Limited has illustrated an FY30 AgriBridge case with annual gross merchandise value of Rs 1,000 crore and platform revenue of Rs 52 crore at a 5.2% monetisation rate, while stating that this is not financial guidance and reporting no realised platform performance. The supplemental investor information was filed on 11 November 2026.
Know SC Agrotech inside out
Results, valuation, peers and who's buying, in one view.
What does SC Agrotech’s FY30 model show?
SC Agrotech’s maximum-scale illustration pairs Rs 1,000 crore of annual gross merchandise value, or GMV, with Rs 52 crore of annual platform revenue in FY30. GMV is defined as the gross value of eligible transactions that might be facilitated through AgriBridge rather than the company’s own revenue, while the Rs 52 crore figure applies a 5.2% blended platform fee or service rate.
The filing sets out a hypothetical progression from Rs 125 crore of GMV and Rs 6.5 crore of revenue in FY28 to Rs 500 crore and Rs 26 crore in FY29, before the FY30 case of Rs 1,000 crore and Rs 52 crore. On those model inputs, GMV and revenue both rise eightfold from FY28 to FY30, with the monetisation assumption unchanged at 5.2%.
SC Agrotech qualifies the FY28-FY30 figures as hypothetical annual allocations rather than forecasts of transaction activity. The filing says achievement depends on adoption and actual transactions, and specifically states that no realised AgriBridge GMV, revenue or earnings are claimed in the 11 November 2026 communication.
How are the AgriBridge capital-deployment cases structured?
SC Agrotech presents Rs 10 crore and Rs 100 crore capital cases as independent, steady-state arithmetic models, not approved spending budgets or funds raised. The Rs 10 crore focused-rollout example assumes Rs 125 crore of annual GMV, while the Rs 100 crore wider-expansion example assumes Rs 1,000 crore, with both cases using the same 5.2% take rate.
At the 5.2% rate, the focused-rollout model shows Rs 6.5 crore in platform revenue, Rs 4.5 crore in annual operating cost and Rs 2 crore in earnings before interest, tax, depreciation and amortisation, or EBITDA. After Rs 0.2 crore of depreciation and finance expense and Rs 0.4 crore of illustrative income tax, the model gives profit after tax, or PAT, of Rs 1.4 crore.
The wider-expansion arithmetic shows Rs 52 crore in revenue and Rs 34 crore of annual operating cost, producing illustrative EBITDA of Rs 18 crore. It then assumes Rs 1.7 crore for depreciation and finance, plus Rs 4.2 crore in income tax, resulting in Rs 12.1 crore of illustrative annual PAT; SC Agrotech says this is not achieved AgriBridge revenue or PAT.
How sensitive is the AgriBridge model to its fee rate?
SC Agrotech’s sensitivity table shows that the assumed monetisation rate is central to the model because operating costs are held constant while the fee changes. In the Rs 100 crore capital case, revenue ranges from Rs 20 crore at a 2.0% take rate to Rs 52 crore at 5.2% and Rs 80 crore at 8.0%, while EBITDA moves from a loss of Rs 14 crore to Rs 18 crore and Rs 46 crore, respectively.
The Rs 10 crore case follows the same pattern: illustrative revenue is Rs 2.5 crore at 2.0%, Rs 6.5 crore at 5.2% and Rs 10 crore at 8.0%. Corresponding EBITDA is a loss of Rs 2 crore, followed by Rs 2 crore and Rs 5.5 crore, showing that the disclosed Rs 4.5 crore operating-cost base is not varied in the fee-rate comparison.
The filing cautions that EBITDA is neither PAT nor cash flow and says all inputs may change materially. The shift from an EBITDA loss of Rs 14 crore to EBITDA of Rs 46 crore in the larger case follows solely from changing the take-rate assumption while holding costs constant, rather than from reported operations.
Got a follow-up? Ask IRIS
What would AgriBridge need to execute the FY28-FY30 model?
SC Agrotech’s illustrative roadmap starts with FY28 activities to build farmer and supplier onboarding, plus product and marketplace workflows. FY29 then envisages expanding buyer and service networks and increasing repeat transactions, while FY30 moves toward commercial order coordination and exploring value-added service layers.
The potential commercial mechanisms include transaction fees on completed eligible orders, fulfilment services covering logistics, quality and coordination, potential paid subscription tiers, and authorised agriculture data and insights. The 5.2% blended monetisation rate in the FY28-FY30 model is therefore a platform-fee and service-rate assumption rather than a disclosed price for a single service.
SC Agrotech says the FY28-FY30 milestones are not contracted or committed, and actual outcomes depend on commercial adoption, buyer conversion, costs, capital availability and regulation. It sets an evidential threshold for operating performance: actual contracts, completed orders, invoices, platform data and realised fees must support any claim that AgriBridge has achieved results.
Why does SC Agrotech say the presentation is not guidance?
SC Agrotech says FY28-FY30 timing is an illustrative progression rather than financial guidance or a committed execution schedule. The 11 November 2026 filing also calls the Rs 1,000 crore GMV case a conditional calculation for investor understanding, not an actual transaction-volume result, contracted order or sanctioned capital-expenditure plan.
The distinction matters because Rs 1,000 crore of GMV is not revenue and the Rs 52 crore revenue figure requires the assumed 5.2% rate. Similarly, the Rs 100 crore capital example is hypothetical deployment arithmetic rather than an approved commitment, while the Rs 12.1 crore PAT output is a standalone steady-state model rather than a company result.
Conclusion
The disclosure presents AgriBridge as a potential platform model rather than a record of current operations: its FY30 illustration links Rs 1,000 crore of GMV to Rs 52 crore of revenue and Rs 18 crore of EBITDA in the larger 5.2% take-rate case. Comparison with the Rs 10 crore case and the 2.0% to 8.0% fee sensitivities shows that assumed scale, fee capture and fixed operating costs drive the presented economics.
The next disclosed stages are FY28 platform building, FY29 network scaling and FY30 commercial-order coordination with possible value-added services. Investors will need to watch for the operating evidence SC Agrotech identifies, including actual contracts, completed orders, invoices, platform data and realised fees, as well as developments in adoption, capital availability and regulation.