










Senco funding shift lifts blended borrowing cost to 8%
Key highlights
- Senco’s blended borrowing cost rose to 8.0% in H1 FY27 from 6.9% in FY26.
- Gold metal loans fell to 17% of Senco’s Rs 2,612.7 crore working-capital borrowings in H1 FY27.
- Senco’s cash-conversion cycle increased to 174 days in H1 FY27 from 170 days in FY26.
- Senco reported Rs 430.78 crore of operating cash outflow in H1 FY27 and Rs 438.88 crore of financing cash inflow.
powered by IRIS
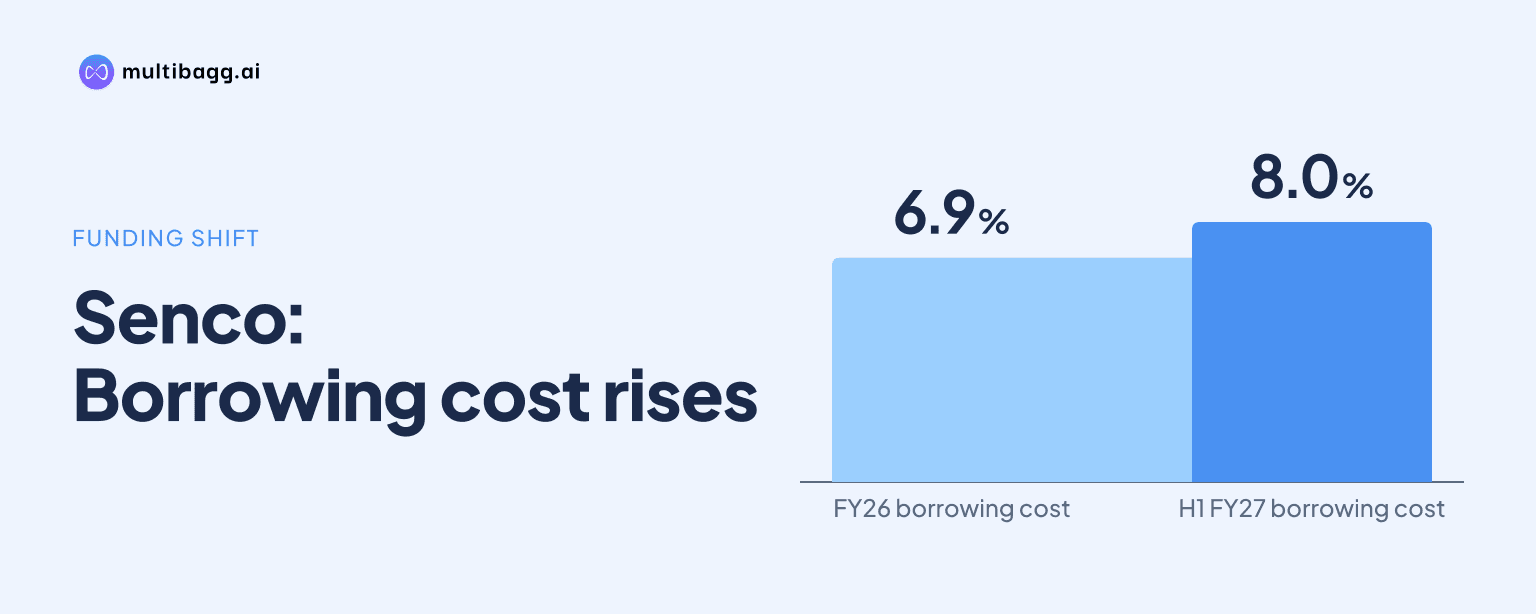
Senco Gold Limited’s blended borrowing cost reached 8.0% in H1 FY27 as gold metal loans represented 17% of Rs 2,612.7 crore of working-capital borrowings, down from 33% in FY26. The funding mix moved toward cash credit and working-capital demand loans, which carried a disclosed 9.3% annual borrowing cost in H1 FY27.
Know Senco Gold inside out
Results, valuation, peers and who's buying, in one view.
Why did Senco’s blended borrowing cost reach 8%?
Senco’s blended borrowing cost reached 8.0% in H1 FY27 because the share of lower-cost gold metal loans, or GML, declined while cash credit, or CC, and working-capital demand loans, or WCDL, formed a larger part of funding. GML carried a 3.9% annual borrowing cost in H1 FY27, compared with 9.3% for CC and WCDL combined.
The shift is clear against earlier periods. GML accounted for 67% of working-capital borrowings in FY25, 33% in FY26 and 17% in H1 FY27. Over the FY25-to-H1 FY27 period, the blended cost rose from 5.9% to 8.0%, while the CC and WCDL cost moved from 9.6% to 9.3%. The disclosed figures therefore show that the change in the borrowing mix, rather than a rise in the CC and WCDL rate, coincided with the higher blended cost.
Senco’s total working-capital borrowings increased by Rs 267.4 crore from FY26 to H1 FY27. WCDL was the largest disclosed component at 59%, up 12 percentage points from 47% in FY26, while CC rose by one percentage point to 21%. Together, CC and WCDL represented 80% of working-capital borrowing in H1 FY27, compared with 67% in FY26.
How did Senco fund inventory ahead of Dhanteras?
Senco funded incremental inventory through higher borrowings, customer advances, trade payables and internal accruals ahead of Dhanteras, according to its H1 FY27 balance-sheet disclosure. Consolidated inventories stood at Rs 5,487.85 crore at September 2026, compared with Rs 5,296.09 crore at March 2026 and Rs 3,299.25 crore at March 2025.
Senco said inventory increased marginally to ensure stock availability ahead of Dhanteras, although average inventory quantity per store remained below FY24 levels. Inventory days nonetheless increased to 191 in H1 FY27 from 183 in FY26, 166 in FY25 and 151 in FY24. The H1 FY27 inventory-days figure is explicitly not annualised.
Gold sourcing also changed. GML and bank sourcing fell to 32% in H1 FY27 from 39% in FY26 and 46% in FY25, while trading in readymade jewellery rose to 41% from 37% and 32%, respectively. Old-jewellery exchange accounted for 22% in H1 FY27, against 24% in FY26, while bullion dealers supplied 6% after no reported contribution in FY26.
The balance sheet records Rs 2,080.50 crore of working-capital borrowings and Rs 434.37 crore of GML at September 2026. Trade payables were Rs 732.02 crore, up from Rs 678.55 crore at March 2026, while customer advances were Rs 757.33 crore, down from Rs 848.41 crore. Senco also stated that trade receivables primarily reflected temporary credit extended to franchisees as business support.
Got a follow-up? Ask IRIS
What does Senco’s 174-day cash-conversion cycle show?
Senco’s cash-conversion cycle was 174 days in H1 FY27, four days longer than FY26’s 170 days and 16 days longer than FY25’s 158 days. The measure has increased from 136 days in FY23, alongside growth in reported inventory days from 147 to 191 over the same comparison.
The working-capital profile coincided with higher sales but lower first-half operating margins. Consolidated revenue from operations grew 52% year on year to Rs 5,114.76 crore in H1 FY27, while earnings before interest, tax, depreciation and amortisation, or EBITDA, increased 35% to Rs 391.17 crore. EBITDA margin declined to 7.6% from 8.6% in H1 FY26.
The second quarter showed a sharper margin change. Q2 FY27 consolidated revenue grew 34% year on year to Rs 2,058.73 crore, but gross margin declined to 12.2% from 17.0%, and EBITDA margin fell to 4.4% from 6.9%. Finance cost increased 50% to Rs 69.43 crore in the quarter and 54% to Rs 137.37 crore in H1 FY27.
Capital employed reached Rs 5,296.4 crore in H1 FY27, up from Rs 4,859.6 crore in FY26, while net worth increased to Rs 2,683.7 crore from Rs 2,513.7 crore. Return on capital employed was reported at 7.8% and return on equity at 7.2% for H1 FY27, with both figures not annualised. Debt-to-equity was 1.0, compared with 0.9 in FY26, and net debt-to-equity was 0.8 versus 0.7.
How did working capital affect Senco’s cash flow?
Senco used Rs 430.78 crore in operating activities during H1 FY27, compared with Rs 333.92 crore used in H1 FY26, as working-capital movements outweighed operating profit before working-capital changes. The company reported Rs 413.36 crore of operating profit before working-capital changes, followed by an operating cash outflow of Rs 265.89 crore before taxes.
Inventory increased by Rs 191.76 crore in H1 FY27, compared with a Rs 1,009.92 crore increase in H1 FY26. The cash-flow statement also records a Rs 341.33 crore GML movement, a Rs 165.67 crore increase in trade receivables, and Rs 164.89 crore of income taxes paid. These items contributed to the reported operating cash outflow.
Financing activities generated Rs 438.88 crore in H1 FY27, compared with Rs 334.61 crore in H1 FY26. The principal disclosed funding item was a Rs 580.24 crore movement in CC and WCDL borrowings, up from Rs 438.33 crore a year earlier. Finance costs and other interest charges absorbed Rs 128.21 crore, while dividends paid were Rs 14.75 crore.
Cash and cash equivalents ended H1 FY27 at Rs 41.55 crore, compared with Rs 37.59 crore at the beginning of the year. The reported net increase was Rs 3.97 crore, following Rs 4.13 crore used in investing activities. The cash-flow statement separately reports GML movements and CC and WCDL financing, consistent with Senco’s distinction between metal-loan funding and cash-based working-capital funding.
Conclusion
Senco’s H1 FY27 figures show that a growing inventory and a 174-day cash-conversion cycle were financed through a substantially different borrowing mix. GML’s share fell from 33% to 17% between FY26 and H1 FY27, while CC and WCDL rose to 80% combined. Since those facilities carried a 9.3% cost versus GML’s 3.9%, the blended borrowing cost rose from 6.9% to 8.0%.
The next disclosed event to watch is the Dhanteras-led inventory cycle for which Senco said it had ensured stock availability. The relevant measures after that period are inventory days, trade receivables and the cash-conversion cycle, as well as whether the mix of GML, CC and WCDL changes from the H1 FY27 levels that coincided with higher finance costs.