










Senco Q2 revenue rose 34%, but EBITDA fell 15% year on year
Key highlights
- Senco’s consolidated Q2 FY27 revenue rose 34% year on year to Rs 2,059 crore.
- Senco’s Q2 FY27 consolidated EBITDA fell 15% year on year to Rs 90 crore, with a 4.4% margin.
- Senco reported 30% Q2 FY27 same-store sales growth and 29% retail growth.
- Senco had 215 showrooms on 30 September 2026, up from 201 on 31 March 2026.
powered by IRIS
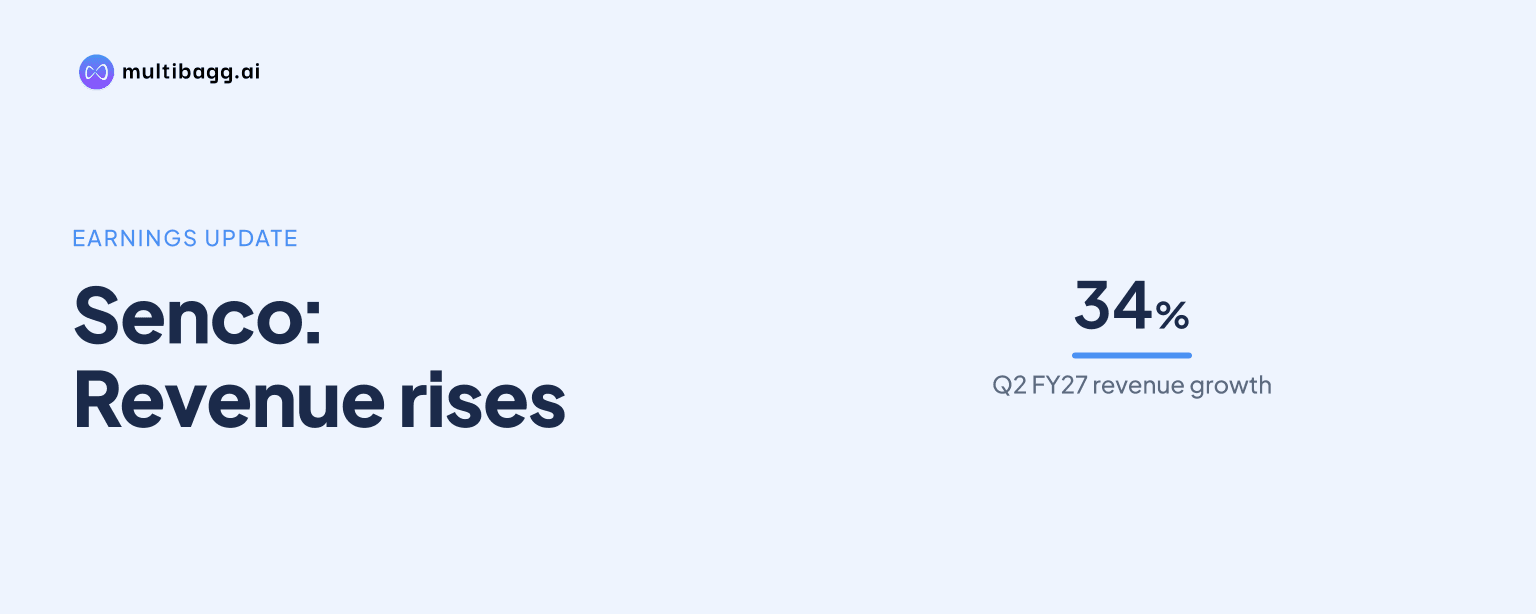
Senco Gold & Diamonds reported 34% year-on-year consolidated revenue growth in Q2 FY27, while earnings before interest, tax, depreciation and amortisation (EBITDA) fell 15% to Rs 90 crore and its EBITDA margin declined to 4.4%. Management attributed the margin pressure to gold exchanges, competition, discounting and a 40% to 50% hedging level.
Know Senco Gold inside out
Results, valuation, peers and who's buying, in one view.
What drove Senco’s Q2 FY27 sales growth?
Senco recorded consolidated revenue of Rs 2,059 crore in Q2 FY27, up 34% year on year, while retail growth was 29%, according to management. Same-store sales growth (SSSG), which measures sales growth at existing stores, was 30%, and management said demand for lightweight jewellery and a favourable festive calendar supported the result.
Management said the Shradh period shifted into Q3 FY27, making the Q2 festive calendar more favourable. Growth was broad-based across regions, led by North, followed by East and Central, while consolidated revenue increased 52% year on year to Rs 5,115 crore in H1 FY27.
The sales growth came alongside a higher average selling price of Rs 76,900 in H1 FY27, compared with Rs 62,200 in FY26. Average ticket value rose to Rs 1,15,500 from Rs 95,100 over the same comparison, showing that the value per transaction increased as revenue expanded.
Senco also reported a 12.2% stud ratio in Q2 FY27, while the H1 FY27 stud ratio was 11.6%, compared with 11.0% in FY26. Management said diamond jewellery value grew 37% in H1 FY27 and volume grew 12%, with premium and accessible price segments contributing to demand.
Why did Senco’s Q2 EBITDA margin decline?
Senco’s consolidated EBITDA declined to Rs 90 crore in Q2 FY27 from the year-earlier period despite the 34% revenue increase, reducing EBITDA margin to 4.4%. Management specifically cited a higher proportion of gold exchanges, competitive pressure, increased discounting and hedging at 40% to 50% as reasons for the Q2 margin outcome.
The difference between Q2 growth and profit is visible in the reported metrics: revenue rose 34%, whereas EBITDA fell 15%. Profit after tax (PAT) nevertheless increased 78% year on year to Rs 87 crore, producing a Q2 PAT margin of 4.2%.
Gold exchange was a significant element of Senco’s retail activity in H1 FY27. The old-gold exchange scheme accounted for about 51% of total retail sales by quantity and represented 41% of procurement in the company’s key highlights, giving the scheme a material role in customer engagement and product sourcing.
Management also disclosed a Rs 30 crore custom-duty gain in Q2 FY27, following a Rs 16 crore gain in Q1 FY27. That disclosure sits alongside the 78% Q2 PAT increase, but Senco did not provide a consolidated earnings bridge that assigns a specific portion of PAT growth to the custom-duty gain.
Got a follow-up? Ask IRIS
How did Senco’s first-half profitability compare with Q2?
Senco’s H1 FY27 consolidated EBITDA rose 35% year on year to Rs 391 crore, and EBITDA margin was 7.6%, above the 4.4% recorded in Q2 FY27. The first-half result therefore showed profit growth over the prior-year half despite the lower second-quarter margin.
PAT for H1 FY27 rose 22% year on year to Rs 188 crore, but the H1 PAT margin was 3.7%, below the Q2 margin of 4.2%. Management said finance cost increased because of a higher mix of non-gold metal loan borrowing and festive borrowings, adding a financing consideration alongside the operating-margin movement.
On a longer reported comparison, consolidated EBITDA margin was 11.5% in FY26, 6.7% in FY25 and 7.2% in FY24, before reaching 7.6% in H1 FY27. The 7.6% H1 FY27 margin was above FY25 and FY24 levels but below FY26, while the 4.4% Q2 margin was lower than the H1 average.
What operating indicators and expansion plans matter next for Senco?
Senco had 215 showrooms as of 30 September 2026, up from 209 on 30 June 2026 and 201 on 31 March 2026. The network included 123 company-operated and 92 franchisee showrooms, and management said it added a net 14 showrooms during H1 FY27.
Management plans another 10 to 12 showroom additions in H2 FY27, with a stated focus on East and North. The company described a franchisee pipeline for H2 FY27 and FY28, including additions in Mohali, Bikaner, Nagpur and Gwalior, while saying store size and continued operation are assessed against break-even and profitability.
Inventory days reached 191 in H1 FY27, compared with 183 in FY26 and 166 in FY25. Management said inventory was built for business growth and Dhanteras readiness, with artificial intelligence-driven tools intended to support continuous inventory optimisation.
Senco’s H2 FY27 outlook calls for 25% revenue growth, EBITDA margin of 7.5% to 7.8%, and a PAT-margin target of 4.0% to 4.5%. These are management targets rather than reported results, and their delivery would be measured against the 4.4% EBITDA margin reported in Q2 FY27 and the 7.6% H1 level.
Conclusion
Senco’s Q2 FY27 results show a divergence between sales and operating profit: consolidated revenue grew 34% to Rs 2,059 crore and same-store sales grew 30%, while EBITDA fell 15% to Rs 90 crore. Management attributed the 4.4% EBITDA margin to gold-exchange activity, competition, discounting and hedging, even as H1 EBITDA grew 35% to Rs 391 crore.
The next reported period will test management’s H2 FY27 plan for 25% revenue growth, a 7.5% to 7.8% EBITDA margin and a 4.0% to 4.5% PAT margin. The planned 10 to 12 H2 showroom additions, inventory positioned for Dhanteras and the franchisee pipeline are the disclosed factors to watch alongside sales growth, working capital and margins.