










Shalby Limited Q2 revenue rises 9.8% as pre-tax profit falls 13.7%
Key highlights
- Shalby’s Q2 FY27 consolidated revenue rose 9.8% year on year to Rs 318.2 crore.
- Shalby’s Q2 FY27 PBT fell 13.7% to Rs 16.5 crore and PBT margin declined to 5.2%.
- Shalby’s hospitals, pharma and franchise operations contributed 80.51% of Q2 FY27 revenue, or Rs 256.18 crore.
- Shalby’s annualised ROCE was 6.6% in Q2 FY27, compared with 14% in FY24.
powered by IRIS
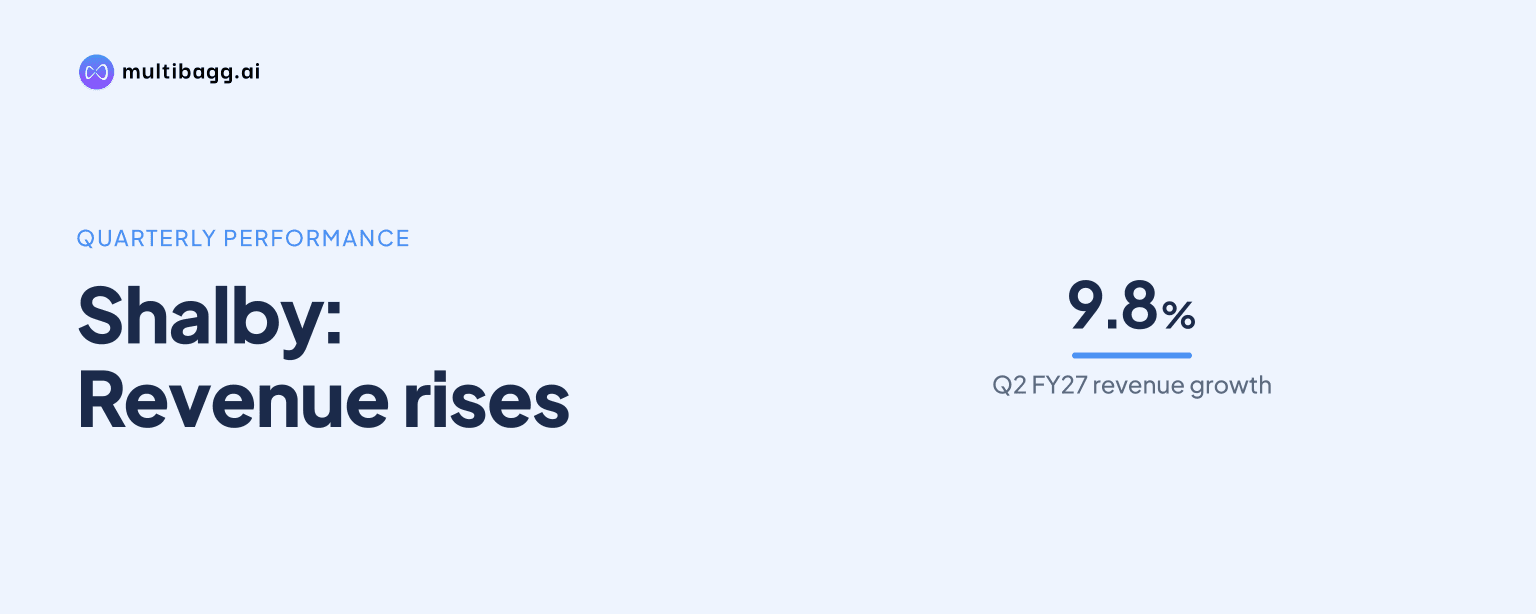
Shalby Limited reported consolidated Q2 FY27 revenue of Rs 318.2 crore, up 9.8% year on year, but profit before tax fell 13.7% to Rs 16.5 crore and its margin declined to 5.2%. Shalby’s earnings before interest, tax, depreciation and amortisation, or EBITDA, increased 0.8% to Rs 46.4 crore, while its EBITDA margin fell from 15.9% to 14.6%.
Know Shalby inside out
Results, valuation, peers and who's buying, in one view.
Why did Shalby’s Q2 pre-tax profit fall despite revenue growth?
Shalby’s presentation reports the divergence between revenue and pre-tax profit but does not provide an expense-level explanation for the Q2 FY27 decline. Revenue increased by Rs 28.3 crore from Rs 289.9 crore in Q2 FY26 to Rs 318.2 crore, while profit before tax, or PBT, decreased by Rs 2.6 crore from Rs 19.1 crore to Rs 16.5 crore. PBT margin consequently declined by 1.4 percentage points from 6.6% to 5.2%.
The Q2 FY27 result was also lower sequentially than Q1 FY27. Revenue was 6.0% below Rs 338.6 crore in Q1 FY27, EBITDA was 5.2% below Rs 49 crore, and PBT was 16.4% below Rs 19.7 crore. The presentation states that EBITDA includes other income, meaning the reported Rs 46.4 crore EBITDA and 14.6% margin include that component.
Profit after tax, or PAT, differed from PBT in the year-on-year comparison. Consolidated PAT rose 8.3% to Rs 7.9 crore in Q2 FY27 from Rs 7.3 crore a year earlier, while PAT margin remained at 2.5%. Against Q1 FY27, PAT fell 24.9% from Rs 10.5 crore and its margin declined from 3.1% to 2.5%.
How did Shalby’s Q2 margins compare with prior periods?
Shalby’s Q2 FY27 EBITDA margin was 14.6%, down 1.3 percentage points from 15.9% in Q2 FY26, although it was 0.1 percentage point above 14.5% in Q1 FY27. PBT margin declined in both comparisons, falling to 5.2% from 6.6% a year earlier and 5.8% in the preceding quarter. Revenue growth therefore did not correspond with higher reported EBITDA or pre-tax margins.
The first-half figures showed the same pattern. H1 FY27 consolidated revenue increased 10.7% to Rs 656.9 crore from Rs 593.3 crore in H1 FY26, while EBITDA rose 0.9% to Rs 95.4 crore from Rs 94.6 crore. EBITDA margin declined to 14.5% from 15.9%, and PBT fell 13.3% to Rs 36.2 crore, with PBT margin down to 5.5% from 7.0%.
Got a follow-up? Ask IRIS
Which Shalby segment contributed the most in Q2 FY27?
Shalby’s hospitals, pharma and franchise operations were the largest Q2 FY27 contributor, generating 80.51% of consolidated revenue, or Rs 256.18 crore, and Rs 41.69 crore of EBITDA. The category includes Shalby Academy, Slaney and Griffin, which the presentation identifies as pharmacy-trading businesses. Its revenue was more than eight times the Rs 31.60 crore reported by the implant business.
Shalby International, including PK Healthcare and fellow subsidiaries in the Delhi-NCR region, contributed 9.32% of Q2 FY27 revenue, or Rs 29.67 crore, and Rs 3.77 crore of EBITDA. Shalby MedTech, identified as the implant business, contributed 9.93% of revenue, or Rs 31.60 crore, but EBITDA of Rs 36 lakh. The presentation listed other operations at Rs 77 lakh of revenue and Rs 62 lakh of EBITDA.
The segment figures place the hospitals, pharma and franchise operation at the centre of the consolidated result. Its Rs 41.69 crore of EBITDA represented most of the consolidated Rs 46.44 crore reported in the segment breakup, while Shalby International contributed Rs 3.77 crore and Shalby MedTech contributed Rs 36 lakh. The consolidated revenue figure in that breakup was Rs 318.22 crore, compared with Rs 318.2 crore in the financial snapshot.
What do Shalby’s half-year and five-year trends show?
Shalby’s consolidated revenue increased from Rs 440 crore in FY21 to Rs 1,168 crore in FY26, representing the presentation’s stated five-year compound annual growth rate, or CAGR, of 21.6%. Revenue increased in every year of the series, including from Rs 1,115 crore in FY25 to Rs 1,168 crore in FY26. H1 FY27 revenue of Rs 656.9 crore was more than half of FY26 annual revenue.
EBITDA increased from Rs 95 crore in FY21 to Rs 170 crore in FY26, a stated five-year CAGR of 12.3%, below the reported revenue CAGR of 21.6%. EBITDA margin was 22% in FY21, reached 21% in FY24, declined to 14% in FY25 and recovered to 15% in FY26. The Q2 FY27 margin of 14.6% was below FY26’s 15% annual margin and FY24’s 21%.
Return on capital employed, or ROCE, increased from 8% in FY21 to 14% in FY24, then declined to 8% in FY25 and 7% in FY26. Shalby reported annualised ROCE of 6.6% in Q2 FY27, or 7.4 percentage points below the FY24 peak. The presentation defines ROCE as annualised earnings before interest and tax divided by average equity plus debt less cash and cash equivalents.
Shalby’s Q2 FY27 balance sheet listed gross borrowings of Rs 537.1 crore and cash and cash equivalents of Rs 78.9 crore, resulting in net debt of Rs 458.2 crore. Debt to equity was 0.45 times. These balance-sheet figures accompany the 6.6% annualised ROCE reading reported for the quarter.
Conclusion
Shalby’s Q2 FY27 numbers show that higher consolidated revenue was accompanied by lower pre-tax profitability and narrower EBITDA and PBT margins. The H1 FY27 comparison points in the same direction, with revenue up 10.7% but PBT down 13.3%, while the five-year series shows EBITDA growth of 12.3% trailing revenue growth of 21.6%.
The next result will be relevant for whether PBT margin moves from Q2 FY27’s 5.2% and whether annualised ROCE moves from 6.6%. The presentation does not identify the cost, financing or other mechanism behind the 13.7% year-on-year PBT decline, leaving that matter unresolved in the disclosed Q2 FY27 information.