










Shalimar Paints Limited FY26 Revenue Hits Rs 19,839 Crore
Key highlights
- Shalimar reported FY26 pro forma revenue of Rs 19,839 crore and EBITDA of Rs 1,709 crore.
- Shalimar's H1 FY27 EBITDA rose 19.2% year on year to Rs 868 crore.
- Shalimar's FY26 EBITDA margin was 8.6%, compared with 5.6% in FY22.
- Own brands represented 69% of Shalimar's FY26 pro forma revenue, up from 33% in FY22.
powered by IRIS
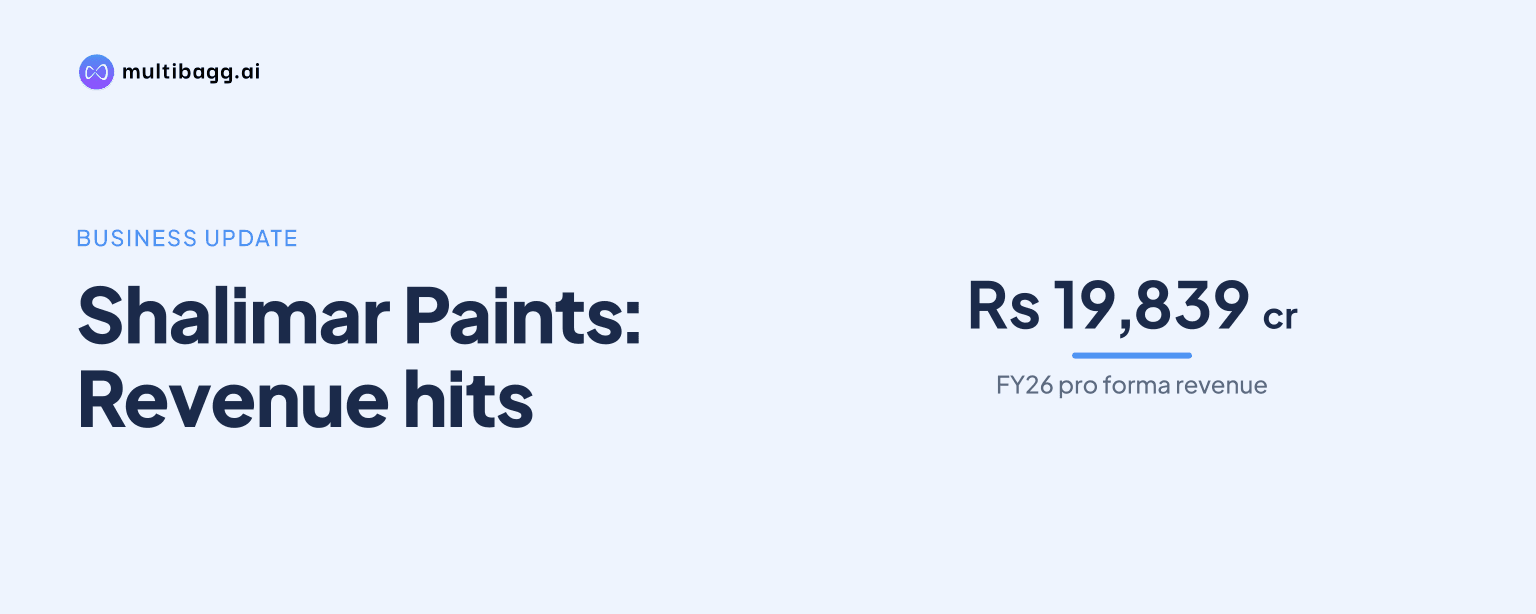
Shalimar Paints Limited recorded FY26 pro forma revenue of Rs 19,839 crore and EBITDA of Rs 1,709 crore, producing an 8.6% margin, in combined financial information derived from Hella Infra Market Limited's audited consolidated accounts. For H1 FY27, limited-review figures showed revenue up 10.1% and EBITDA up 19.2% year on year.
Know Shalimar Paints inside out
Results, valuation, peers and who's buying, in one view.
What did Shalimar report for FY26 and H1 FY27?
Shalimar reported FY26 pro forma revenue from operations of Rs 19,839 crore, EBITDA of Rs 1,709 crore and profit after tax of Rs 243 crore. EBITDA means earnings before interest, tax, depreciation and amortisation, and the disclosed measure excludes other income. The FY26 figures are derived from Infra.Market's audited consolidated accounts, which already consolidate Shalimar, and the EBITDA margin was 8.6%.
For H1 FY27, Shalimar's pro forma revenue rose to Rs 10,302 crore from Rs 9,355 crore in H1 FY26, while EBITDA increased to Rs 868 crore from Rs 728 crore. EBITDA therefore grew 19.2%, faster than revenue growth of 10.1%, while the margin increased by 64 basis points to 8.4% from 7.8%. Profit after tax rose to Rs 116 crore from Rs 37 crore, or 3.2 times.
How has Shalimar's revenue and margin changed since FY22?
Shalimar's pro forma revenue increased from Rs 6,236 crore in FY22 to Rs 19,839 crore in FY26, more than tripling across four financial years. During the same period, the EBITDA margin increased to 8.6% in FY26 from 5.6% in FY22, a rise of 3.0 percentage points.
The announcement attributes the margin change to a larger proportion of sales from owned brands and manufacturing. Own brands represented 33% of revenue in FY22 and 69% in FY26, while third-party distribution accounted for 18% of FY26 revenue. The disclosed mix indicates a shift away from the distribution-led model described for FY22.
What drove Shalimar's FY26 profitability improvement?
Shalimar said its higher own-brand sales, owned manufacturing base and retail expansion contributed to the FY26 improvement. Its three-year manufacturing capital-expenditure cycle was largely complete by FY26, and capital expenditure nearly halved during that year as recently commissioned plants entered the operating base.
Management said owned manufacturing has higher contribution margins than distribution and that retail is its highest-margin route to market. Retail touchpoints increased 23% in FY26, alongside the increase in own-brand revenue to 69%. Infra.Market's in-house technology stack covers demand signals, customer onboarding, credit limits, pricing, plant integration, logistics and delivery tracking, and the company estimates that it saves about half of sales officers' time.
Got a follow-up? Ask IRIS
Which segments contributed most to Shalimar's FY26 revenue?
Structural materials were Shalimar's largest FY26 pro forma segment, contributing 64.0% of revenue, followed by lifestyle products at 14.3% and finishing products at 12.2%. Other activities, covering chemicals, equipment and construction services, made up the remaining 9.5% of FY26 pro forma revenue.
Structural materials include ready-mix concrete, steel, aggregates, construction chemicals, cement and cementitious products. Finishing includes AAC blocks and walling, roofing, and wood panels, while lifestyle includes tiles, sanitaryware, paints, electrical appliances, modular kitchens and hardware. Management said this portfolio would cover 90% to 95% of a typical construction project's material needs after the merger is completed.
Can Shalimar grow using its existing manufacturing base?
Management believes Shalimar's existing asset base can support two to three times current volumes in manufactured categories without substantial additional capital expenditure. The categories identified include ready-mix concrete, AAC blocks, steel, tiles, wood panels and paints, following a manufacturing build-out that was largely completed over three years.
On completion of the proposed transaction, the combined business would have more than 250 plants across 22 states, including more than 150 owned plants and the remainder through exclusive tie-ups. It would also have more than 20,000 retail touchpoints and more than 1,500 corporate customers, compared with Shalimar's standalone FY26 revenue of Rs 569 crore and three plants. These measures remain conditional on completion of the merger.
Conclusion
Shalimar's pro forma information shows FY26 revenue of Rs 19,839 crore, EBITDA of Rs 1,709 crore and an 8.6% margin, compared with FY22 revenue of Rs 6,236 crore and a 5.6% margin. H1 FY27 extended that pattern, with EBITDA rising 19.2% year on year, faster than the 10.1% rise in revenue, alongside a larger disclosed contribution from own brands and manufacturing.
The next development to watch is the proposed merger of Infra.Market into Shalimar, which requires shareholder, regulatory and other approvals. Management has said the existing manufacturing base could support two to three times current volumes, while a qualified institutions placement of up to Rs 1,000 crore has been approved by the board and shareholders and could alter the stated post-merger shareholding if undertaken.