










Shilpa Medicare 2QFY27 revenue hits Rs 538 crore, margins fall
Key highlights
- Shilpa reported record 2QFY27 total income of Rs 538 crore, up 45% year on year.
- 2QFY27 EBITDA reached a record Rs 151 crore, but margin declined to 28% from 30%.
- 2QFY27 PAT rose 80% year on year to Rs 79 crore, while falling from Rs 101 crore in 1QFY27.
- 1HFY27 total income was Rs 1,007 crore and PAT was Rs 180 crore, up 44% and 98% year on year.
powered by IRIS
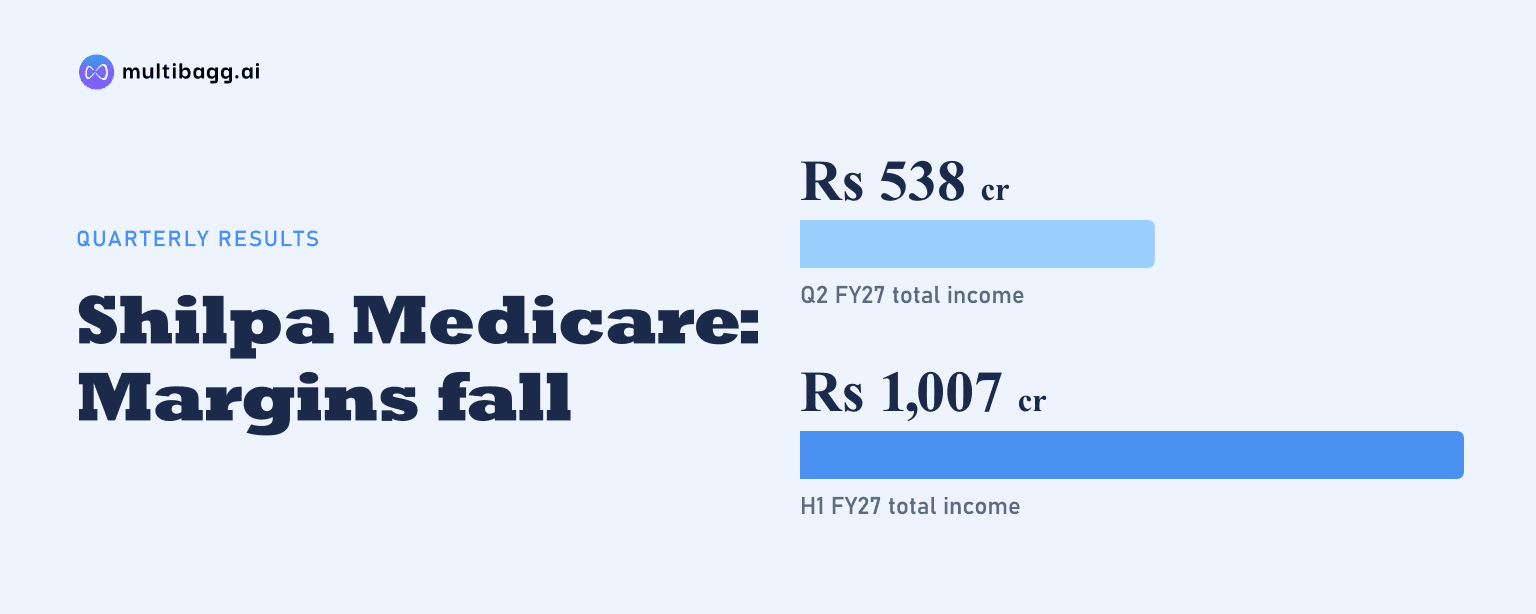
Shilpa reported record consolidated total income of Rs 538 crore in 2QFY27, up 45% year on year and 15% quarter on quarter, while its earnings before interest, tax, depreciation and amortisation (EBITDA) margin fell to 28% from 30% in both comparison periods. Profit after tax (PAT) nevertheless rose 80% year on year to Rs 79 crore.
Know Shilpa Medicare inside out
Results, valuation, peers and who's buying, in one view.
What drove Shilpa's 2QFY27 revenue record?
Shilpa's record 2QFY27 income was driven by growth across all operating verticals, according to management, with consolidated revenue reaching Rs 538 crore versus Rs 372 crore in 2QFY26 and Rs 469 crore in 1QFY27. The quarterly gain of Rs 166 crore from a year earlier was accompanied by a Rs 69 crore increase from the preceding quarter.
The active pharmaceutical ingredient (API) business was the largest contributor to 2QFY27 consolidated revenue at Rs 254 crore, or 47% of the total. Formulations supplied Rs 210 crore, or 39%, followed by biologicals at Rs 65 crore, or 12%, and others at Rs 9 crore, or 2%. The separately reported API division generated Rs 298 crore including captive revenue, its highest quarterly level, versus Rs 256 crore in 2QFY26.
Did Shilpa's profitability keep pace with sales?
Shilpa's EBITDA increased 37% year on year to a record Rs 151 crore in 2QFY27, but the EBITDA margin decreased by 2 percentage points to 28% from 30% in 2QFY26. It also declined by 2 percentage points from 30% in 1QFY27, although EBITDA itself rose Rs 12 crore sequentially from Rs 139 crore.
The larger movement was in gross profit margin, which fell to 65% in 2QFY27 from 72% a year earlier and 71% in 1QFY27. Gross profit still increased to Rs 349 crore, up 31% year on year and 5% quarter on quarter. Sales and gross profit therefore rose in rupee terms, while gross profit and EBITDA represented a smaller share of revenue than in both comparison quarters.
PAT showed a different pattern. Quarterly PAT rose to Rs 79 crore from Rs 44 crore in 2QFY26, lifting PAT margin to 15% from 12%, but PAT was lower than Rs 101 crore and a 22% margin in 1QFY27. Operating profit before tax (PBT), before exceptional items, was Rs 104 crore in 2QFY27, with a 19% margin, compared with Rs 65 crore and 17% a year earlier and Rs 92 crore and 20% in the previous quarter.
Got a follow-up? Ask IRIS
Which businesses contributed to Shilpa's first-half growth?
Shilpa reported first-half FY27 total income of Rs 1,007 crore, up 44% from Rs 700 crore in 1HFY26, marking the first time its half-year income crossed Rs 1,000 crore. EBITDA increased 40% to Rs 290 crore from Rs 208 crore, while PAT rose 98% to Rs 180 crore from Rs 91 crore.
The first-half revenue mix was led by API at Rs 470 crore, or 47% of income, followed by formulations at Rs 407 crore, or 40%. Biologicals contributed Rs 117 crore, or 12%, and others accounted for Rs 13 crore, or 1%. This mix was broadly consistent with the second quarter, when API and formulations together represented 86% of the Rs 538 crore total.
The API division's separately stated first-half revenue, including captive business, was Rs 558 crore, up from Rs 481 crore in 1HFY26. Its non-captive portfolio grew about 20% year on year in the half, while specialty contract development and manufacturing organisation (CDMO) revenue rose to Rs 62 crore from Rs 42 crore. Management attributed the quarterly 36% specialty CDMO growth to new client acquisitions in developed markets.
First-half margins also show the difference between profit growth and margin direction. Gross profit margin declined to 68% in 1HFY27 from 74% in 1HFY26, and EBITDA margin moved to 29% from 30%. PAT margin expanded to 18% from 13%, meaning the Rs 89 crore increase in first-half PAT outpaced the Rs 82 crore increase in EBITDA over the year-earlier period.
What do Shilpa's returns and balance-sheet metrics show?
Shilpa reported adjusted return on capital employed (ROCE) of 18.2% on a trailing-12-month basis for 1HFY27, compared with 17.4% in FY26, 15.0% in FY25 and 9.3% in FY24. The measure excludes investments in potential high-growth biologics and novel biological entities businesses, so it does not cover all invested capital.
Net debt to EBITDA stood at 1.3 times in 1HFY27 on the same trailing-12-month basis, down from 1.4 times in FY26 and 6.7 times in FY23. Gross block increased to Rs 2,393 crore at 1HFY27 from Rs 2,281 crore in FY26, while net capital expenditure was Rs 252 crore in the first half, compared with Rs 361 crore for all of FY26. The presentation states that the credit rating moved from A+ to AA-, attributing the category shift to a strengthening balance sheet and improving return ratios.
Management said its novel finished dosage form portfolio has niche launches lined up through FY27 and beyond. It also cited an expanded exclusive European arrangement with Orion Corporation for Shilpa's Nivolumab biosimilar, under which Shilpa is the development and supply partner, as part of its innovation-led partnership strategy.
Conclusion
Shilpa combined record quarterly income of Rs 538 crore and record EBITDA of Rs 151 crore with 45% and 37% year-on-year growth, respectively. The main qualification is that gross margin declined from 72% to 65% and EBITDA margin from 30% to 28% in 2QFY27, even as first-half PAT nearly doubled to Rs 180 crore.
The next reported milestones are management's planned niche finished dosage form launches through FY27 and beyond, along with execution of the European Nivolumab biosimilar arrangement with Orion Corporation. Investors can also track whether the 1HFY27 EBITDA margin of 29%, adjusted ROCE of 18.2% and net debt-to-EBITDA ratio of 1.3 times change as capital expenditure and the biologics pipeline progress.