










Smartworks says 13 Msf mature base makes cash flow positive
Key highlights
- Smartworks reported H1 FY27 free cash flow of negative Rs 104.4 crore, as capex of Rs 306.6 crore exceeded normalised operating cash flow of Rs 202.2 crore.
- Smartworks’ mature-centre footprint was 9.7 Msf on 30 September 2026, versus the 13 Msf threshold management says is needed for self-funding growth.
- Smartworks had a 17.5 Msf platform in September 2026, including 10.9 Msf of operational space and 6.6 Msf not yet open.
- Q2 FY27 normalised EBITDA rose 68% year on year to Rs 116.9 crore, while normalised EBITDA margin reached 19.8% and annualised RoCE reached 21.6%.
powered by IRIS
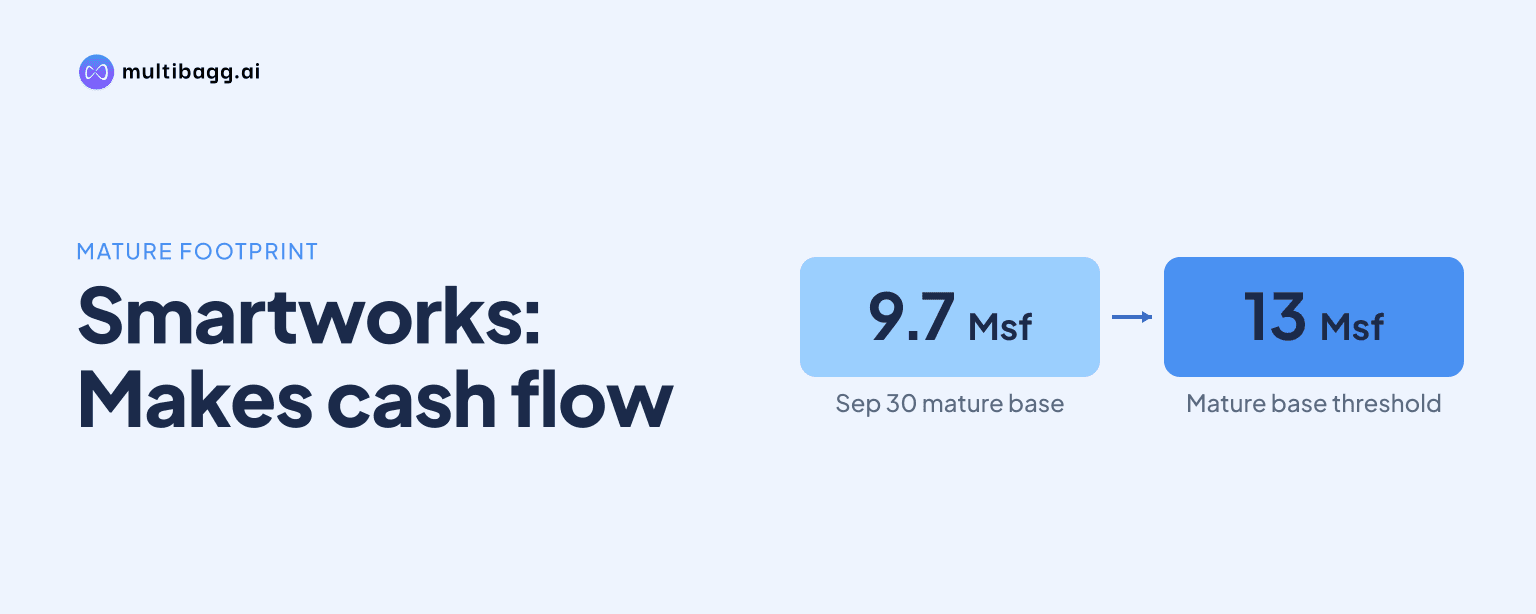
Smartworks reported negative free cash flow of Rs 104.4 crore in H1 FY27 as Rs 306.6 crore of capex exceeded Rs 202.2 crore of normalised operating cash flow. Smartworks says the cycle becomes self-sustaining once its mature-centre footprint reaches 13 Msf, compared with 9.7 Msf as of 30 September 2026.
Know Smartworks Coworking Spaces inside out
Results, valuation, peers and who's buying, in one view.
Why is Smartworks free cash flow negative today?
Smartworks’ free cash flow is negative because capital expenditure and deposits for new centres are being paid before those sites have fully opened, filled and generated cash. In H1 FY27, normalised operating cash flow, or OCF, was Rs 202.2 crore and capex was Rs 306.6 crore, resulting in the reported free-cash-flow outflow of Rs 104.4 crore.
The current investment gap is larger than in FY26. For the FY26 full year, normalised OCF of Rs 356.4 crore was below capex of Rs 388 crore, an implied difference of Rs 31.6 crore. H1 FY27 capex alone equalled almost 79% of FY26 capex, showing that Smartworks is funding a heavier build-out in the current cycle.
Smartworks said its working-capital model had not changed: debtor days were seven and client deposits arrived before construction. Its reported normalised OCF-to-normalised EBITDA ratio was 0.9 times in both Q1 FY27 and Q2 FY27, after 1.4 times in Q1 FY26, 0.9 times in Q2 FY26, 1.2 times in Q3 FY26 and 1.1 times in Q4 FY26. Management attributes the lower reported conversion to deposits on buildings that have not yet opened.
When does Smartworks expect positive free cash flow?
Smartworks says free cash flow turns positive when its mature-centre footprint reaches 13 Msf, because cash from mature centres can then cover capex for new ones. The mature footprint was 9.7 Msf on 30 September 2026, leaving about 3.3 Msf to mature before the stated threshold is reached.
Management expects reported OCF conversion to remain below one time through Q4 while deposits for two second-half campuses are paid. It expects conversion to rise above one time during FY28 as those campuses open and their deposits return, with free cash flow following a few quarters later as the mature base approaches 13 Msf.
The stated threshold is tied to the existing maturity profile. Smartworks said mature space could rise from 9.7 Msf to about 13 Msf by FY28 as new sites mature and 4.3 Msf under fit-out or awaiting handover opens. The presentation said the ageing of the existing portfolio alone could lift margin and return on capital employed, or RoCE, through FY28 even without new wins.
How much Smartworks capacity is still being built or filled?
Smartworks had a 17.5 Msf platform in September 2026, of which 10.9 Msf was operational and 6.6 Msf was not yet open. The unopened component consisted of 4.3 Msf under fit-out or awaiting handover and 2.3 Msf covered by letters of intent, or LOIs.
The operational estate also contains centres at different stages of cash generation. Of the 10.9 Msf operational footprint, 7.5 Msf had opened more than 24 months earlier, 2.1 Msf had been open for 12 to 24 months, and 1.3 Msf had been open for less than 12 months. Smartworks described about 3 Msf as still filling, including 2.1 Msf under fit-out.
Newer centres had lower committed occupancy than the mature estate at 30 September 2026. Smartworks reported 91% committed occupancy for 9.7 Msf of mature space and 48% for 1.3 Msf of new space. It also said 31% of operational saleable business area, or SBA, had opened during the preceding 24 months, indicating that a material part of the operating portfolio remains in its ramp-up period.
Got a follow-up? Ask IRIS
How quickly do Smartworks centres mature and generate returns?
Smartworks says a new centre goes live about four months after signing, reaches break-even at roughly 60% occupancy after about 12 months, and reaches 85% to 90% occupancy in less than 18 months. The company said 20% to 25% of a centre is pre-committed at signing, providing initial demand before a site opens.
Centre scale has increased without changing Smartworks’ stated time to a full centre. New-centre size was 150,000 to 300,000 square feet before 2022, compared with 300,000 to 700,000 square feet in FY22 to FY26. Over the same comparison, pre-fill increased from below 10% to 20% to 25%, while ramp-up to 85% to 90% occupancy remained below 18 months.
Smartworks had invested about Rs 200 crore in capex and security deposits for upcoming centres by 30 September 2026. This represented about 20% of normalised capital employed and related to centres that had not yet opened. Net debt was Rs 82.7 crore at September 2026, compared with Rs 5.6 crore in June 2026, while Q2 capex of Rs 155.6 crore was 64% higher year on year.
Have Smartworks’ earlier capex cycles improved margins and returns?
Smartworks reported higher EBITDA margin and RoCE through its first two expansion cycles. In Cycle 1, from FY23 to FY25, operational footprint increased from 6.2 Msf to 8.1 Msf, EBITDA margin rose from 6.1% to 13.1%, and RoCE moved from negative territory to 7.3%.
In Cycle 2 during FY26, operational footprint expanded from 8.1 Msf to 10.1 Msf, while EBITDA margin rose from 13.1% to 17.5% and RoCE from 7.3% to 16.0%. Cycle 3 targets about 3 Msf of space additions a year and an operational footprint of 12.5 Msf to 13 Msf in FY27; its reported H1 performance showed 19.7% EBITDA margin and 20.4% annualised RoCE.
Quarterly data showed the same direction of change. Annualised normalised RoCE increased from 12.7% in Q1 FY26 to 21.6% in Q2 FY27, while normalised EBITDA margin rose from 16.2% to 19.8%. Q2 FY27 normalised EBITDA was Rs 116.9 crore, up 68% year on year and 9% quarter on quarter, according to Smartworks.
Conclusion
Smartworks’ cash-flow case depends on turning currently invested capital and new capacity into mature centres. The Rs 104.4 crore H1 FY27 free-cash-flow outflow reflects capex and deposits running ahead of OCF, while the company’s reported margin and RoCE progression reflects contributions from earlier cohorts as they mature.
The next disclosed markers are deposits for two second-half campuses, OCF conversion through Q4, and management’s expectation of above-one-time conversion during FY28 as campuses open and deposits return. Smartworks also plans for its mature footprint to move from 9.7 Msf toward about 13 Msf by FY28, the level management says would make growth self-funding.