










Smartworks’ 1,000+ seat clients deliver 41% rental revenue
Key highlights
- Clients with more than 1,000 seats generated 41% of Smartworks’ rental revenue in Q2 FY27, up from 12% in FY22.
- Smartworks reported a 36-month lock-in period for its 1,000+ seat client cohort in Q2 FY27, compared with 27 months in FY22.
- About 77% of Smartworks’ additional revenue in Q2 FY27 versus Q2 FY26 came from non-IT sectors.
- Smartworks reported about Rs 3,740 crore of client lock-in revenue against about Rs 1,915 crore of landlord lock-in rental for its operational footprint.
powered by IRIS
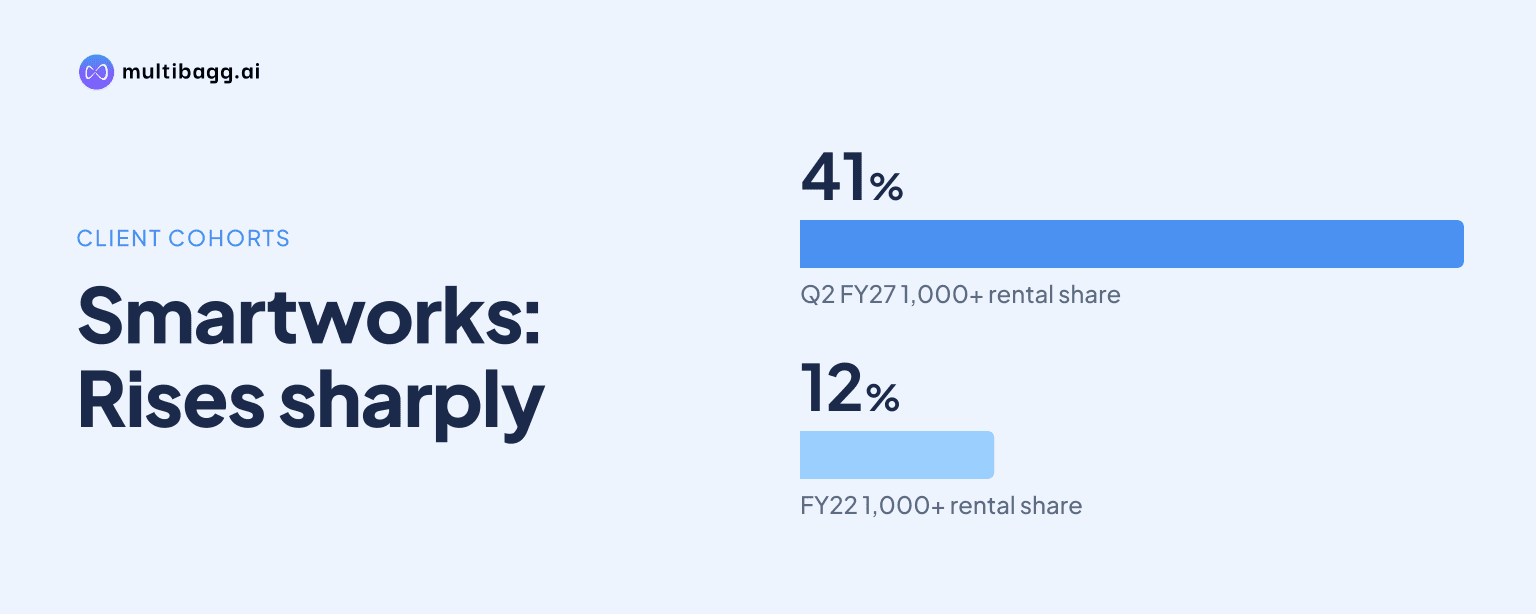
Smartworks’ clients with more than 1,000 seats accounted for 41% of rental revenue in Q2 FY27, up from 12% in FY22. The cohort’s reported lock-in period was 36 months, while Smartworks reported about Rs 3,740 crore of client lock-in revenue against about Rs 1,915 crore of landlord lock-in rental across its operational footprint.
Know Smartworks Coworking Spaces inside out
Results, valuation, peers and who's buying, in one view.
How important are Smartworks’ 1,000+ seat clients to rental revenue?
Smartworks’ 1,000+ seat client cohort contributed 41% of rental revenue in both Q1 FY27 and Q2 FY27, compared with 37% in FY26, 29% in FY25 and 12% in FY22. Its share therefore increased by 29 percentage points from FY22 to Q2 FY27, making larger occupiers a bigger part of Smartworks’ rental-revenue mix.
As of 30 September 2026, Smartworks reported more than 35 clients with over 1,000 seats and more than 75 clients in more than one city. Examples include a US customer-experience client with more than 8,500 seats in four cities, an Indian IT services client with more than 4,200 seats in seven cities, and a global logistics client that expanded from one city to four in under three years.
Smartworks lists Rs 196.6 crore as a 1,000+ cohort revenue figure and Rs 574.6 crore for FY26, although the displayed data does not label the period for the Rs 196.6 crore figure. The reported revenue-share sequence nevertheless shows that the 1,000+ seat cohort gained importance over the five-year period through Q2 FY27.
How have Smartworks’ terms changed for large clients?
Smartworks’ reported lock-in period for the 1,000+ seat cohort rose to 36 months in Q2 FY27 from 27 months in FY22. Total tenure increased to 49 months from 42 months over the same period, although it had reached 52 months in FY25 before declining to 49 months in FY26 and remaining there in Q2 FY27.
The progression was not uniform: lock-ins were 27 months in FY22 and FY23, 30 months in FY24, 33 months in FY25, 36 months in FY26 and 35 months in Q1 FY27 before returning to 36 months in Q2 FY27. Management links larger deal sizes with longer lock-ins, while the disclosed figures apply to the cohort rather than establishing a minimum term for every customer.
Smartworks also reported that its largest client accounted for less than 5% of rental revenue as of 30 September 2026, while the top 10 clients accounted for about 24%. That comparison distinguishes exposure to an individual customer from the rising contribution of the broader large-client cohort.
Which sectors are driving Smartworks’ additional revenue?
Smartworks said enterprise clients accounted for about 91% of rental revenue and multi-city clients for about 35% as of 30 September 2026. Its examples span customer experience, consulting, logistics, technology, engineering and financial services, including a Japanese non-banking financial company that became a new client in Mumbai in H1 FY27.
About 77% of additional revenue in Q2 FY27 versus Q2 FY26 came from non-information-technology sectors. Business consulting and professional services contributed 39% of that increase, banking, financial services and insurance contributed 15%, engineering and manufacturing 14%, and other sectors 9%, compared with 23% from IT, technology and software development.
Smartworks’ IT and IT-enabled services exposure declined from about 44% of the portfolio in FY24 to about 36% in Q2 FY27. Meanwhile, the top-10 client share increased from 20% in Q2 FY26 to 24% in Q2 FY27; Smartworks attributes the change to existing clients taking more seats, expanding into more cities and signing longer lock-ins.
Got a follow-up? Ask IRIS
How does Smartworks’ client lock-in cover landlord rentals?
Smartworks reported about Rs 3,740 crore of committed client lock-in revenue against about Rs 1,915 crore of committed lock-in rental to landlords for its 10.9 million square foot operational footprint as of 30 September 2026. This equates to overall cover of about two times, and management says there is no funding gap through FY30.
The operational footprint comprised 9.7 million square feet of mature space with 91% committed occupancy and 1.3 million square feet of new space with 48% committed occupancy. Mature space had more than 2.5 times client lock-in cover, with about Rs 3,220 crore of client lock-in revenue versus about Rs 1,225 crore of landlord rental, while new space had about 0.8 times cover, with Rs 520 crore against Rs 690 crore.
Smartworks separately reported about Rs 5,790 crore of committed client revenue for the operational footprint, exceeding the Rs 3,740 crore within client lock-in periods. Management says lock-in cover for the new footprint rises as occupancy ramps up, making the 48% committed-occupancy level relevant to the difference between mature and new-space coverage.
What concentration and lease risks does Smartworks identify?
Smartworks identifies cyclical demand, concentration and asset-liability mismatch as three model risks. For concentration, it says a single client typically occupies no more than about 30% of a centre above 0.20 million square feet, while IT and IT-enabled services represented about 36% of the portfolio in Q2 FY27.
Smartworks had 17.5 million square feet of total secured built-up area, or SBA, as of 30 September 2026, comprising 10.9 million operational, 2.1 million under fit-outs, 2.3 million yet to be handed over and 2.2 million under letters of intent, term sheets or heads of terms. Pune was the largest city at 5.4 million square feet, or 31% of SBA, compared with 4.7 million square feet, or 28%, in June 2026.
For asset-liability risk, Smartworks says it uses long-term agreements with both landlords and clients and targets rental revenue of at least two times rental expense. It leases 68% of its space in buildings above 300,000 square feet, with about 33% leased from institutional developers and about 67% from non-institutional landlords.
Conclusion
Smartworks’ disclosures indicate a more enterprise-led rental base: 1,000+ seat clients generated 41% of rental revenue in Q2 FY27, versus 12% in FY22, and their reported lock-in period increased from 27 to 36 months. The sector mix also changed, with non-IT sectors supplying about 77% of additional Q2 FY27 revenue year on year and IT and IT-enabled services exposure declining to about 36% from about 44% in FY24.
The next measure to watch is the occupancy ramp at the 1.3 million square feet of new operational space, where lock-in cover was about 0.8 times at 48% committed occupancy, compared with more than 2.5 times for mature space. Management’s stated plan is for coverage to rise with occupancy while maintaining overall client lock-in cover of about two times landlord rentals and no funding gap through FY30.