










Somany Ceramics Limited Q2 PAT Rises 237.6% as Margin Expands
Key highlights
- Somany’s Q2 FY27 consolidated PAT rose 237.6% to Rs 42 crore from Rs 12 crore.
- Somany’s consolidated EBITDA margin expanded by 3.8 percentage points to 11.7% in Q2 FY27.
- Somany’s Q2 FY27 consolidated sales increased 25.4% to Rs 854 crore.
- Somany’s total tile volume grew 5% to 18.77 msm in Q2 FY27.
powered by IRIS
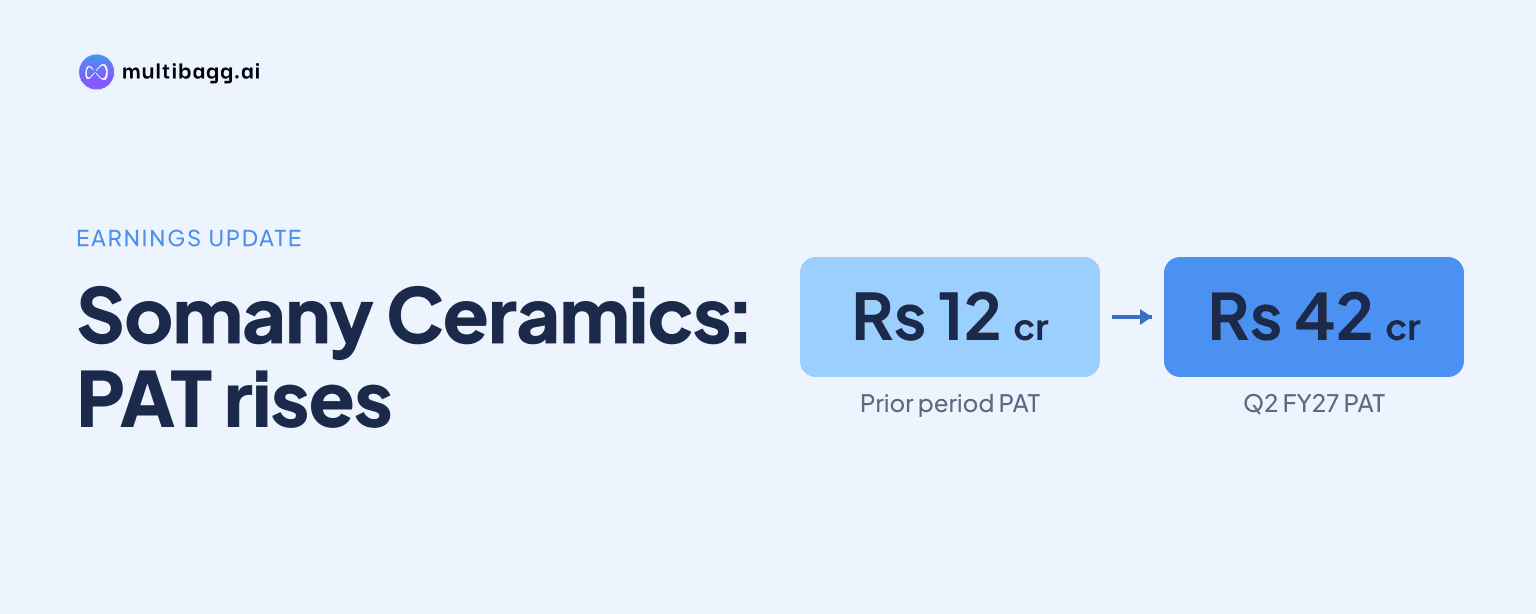
Somany Ceramics Limited reported consolidated profit after tax of Rs 42 crore in Q2 FY27, up 237.6% from Rs 12 crore a year earlier, as sales rose 25.4% to Rs 854 crore and EBITDA margin expanded by 3.8 percentage points to 11.7%.
Know Somany Ceramics inside out
Results, valuation, peers and who's buying, in one view.
How did Somany’s consolidated Q2 FY27 profit change?
Somany’s consolidated profit after tax, or PAT, rose to Rs 42 crore in Q2 FY27 from Rs 12 crore in Q2 FY26, an increase of 237.6%. Profit before tax, or PBT, increased to Rs 62 crore from Rs 19 crore, while earnings per share rose to Rs 10.12 from Rs 3.65. PAT attributable to controlling interest was Rs 42 crore, compared with Rs 15 crore, representing growth of 176.9%.
The profit increase outpaced sales growth because operating earnings rose faster than revenue. Consolidated earnings before interest, tax, depreciation and amortisation, or EBITDA, increased 86.4% to Rs 100 crore from Rs 54 crore. PBT margin rose by 4.6 percentage points to 7.3% from 2.7%, while tax expense increased to Rs 19 crore from Rs 6 crore. The Q2 FY27 statement also recorded an exceptional item of Rs 2 crore, against none in Q2 FY26.
What caused Somany’s EBITDA margin to expand?
Somany’s consolidated EBITDA margin increased to 11.7% in Q2 FY27 from 7.9% in Q2 FY26, a 3.8-percentage-point expansion. Management attributed the movement to a richer product mix, operating leverage and continued cost-efficiency efforts. EBITDA increased by Rs 46 crore, while sales increased by Rs 173 crore over the same quarter-on-quarter comparison.
The H1 FY27 figures showed a similar margin change. Consolidated EBITDA rose 82.8% to Rs 186 crore from Rs 102 crore in H1 FY26, and the EBITDA margin increased to 11.6% from 7.9%. H1 FY27 sales grew 24.6% to Rs 1,598 crore from Rs 1,282 crore, leaving the Q2 FY27 margin 0.1 percentage point above the first-half margin.
Which Somany businesses contributed to Q2 FY27 sales growth?
Somany’s own-manufacturing business delivered the largest absolute increase among the disclosed Q2 FY27 sales categories, rising by Rs 59.90 crore to Rs 243.18 crore from Rs 183.28 crore. Outsourced-tile sales increased by Rs 54.27 crore to Rs 257.54 crore, while tile joint-venture sales rose by Rs 38.02 crore to Rs 222.03 crore. Bathware sales rose to Rs 87.83 crore from Rs 76.39 crore, and other sales reached Rs 42.95 crore from Rs 33.58 crore.
Tile volumes grew more slowly than sales value in Q2 FY27. Total tile volume increased 5% to 18.77 million square metres, or msm, from 17.80 msm in Q2 FY26. Own-manufacturing volume rose to 6.84 msm from 5.93 msm, whereas joint-venture volume was 4.98 msm against 4.94 msm and outsourced-tile volume was 6.95 msm against 6.93 msm. This gap between volume growth and sales-value growth coincided with management’s stated richer product mix.
H1 FY27 also shifted volume toward own manufacturing. Total tile volume rose 4% to 35.23 msm from 33.81 msm, with own-manufacturing volume increasing to 13.51 msm from 11.39 msm and joint-venture volume rising to 9.80 msm from 9.43 msm. Outsourced volume declined to 11.92 msm from 12.99 msm, although outsourced-tile sales increased to Rs 441.95 crore from Rs 380.18 crore.
Got a follow-up? Ask IRIS
What do Somany’s capacity and balance-sheet figures show?
Somany reported annual tile capacity of about 80 msm, including dedicated outsourcing arrangements, while sanitaryware capacity was 0.48 million pieces and bath-fittings capacity was 1.30 million pieces, both excluding outsourcing arrangements. Q2 FY27 tile production was 13.09 msm, comprising 7.41 msm at own plants and 5.68 msm at joint ventures. The company described tile and faucet utilisation as optimum and sanitaryware utilisation as 80%.
Consolidated working-capital days increased to 20 in September 2026 from 9 in March 2026. Inventory rose to Rs 417 crore from Rs 352 crore and trade payables increased to Rs 402 crore from Rs 334 crore, while debtors declined to Rs 287 crore from Rs 301 crore. Consolidated net debt rose to Rs 171 crore from Rs 105 crore, and the net-debt-to-equity ratio increased to 0.19 from 0.12.
The September 2026 net-debt figure included Rs 25 crore of debt for solar and other energy-related investments, according to Somany. Consolidated total debt was Rs 277 crore at H1 FY27, compared with Rs 251 crore at FY26, while consolidated net worth increased to Rs 896 crore from Rs 842 crore. These figures distinguish gross borrowings from the reported net-debt measure used in the working-capital disclosure.
Conclusion
Somany converted 25.4% Q2 FY27 consolidated sales growth into a 237.6% increase in reported PAT as EBITDA grew 86.4% and margin reached 11.7%. Own manufacturing added the most sales value among disclosed categories, while tile volume increased 5%, indicating that the reported sales growth exceeded the increase in tile volumes.
The next disclosures should show whether the richer mix, operating leverage and cost-efficiency measures cited by management can sustain the 11.6% H1 FY27 EBITDA margin. Investors can also watch whether working-capital days move from 20 in September 2026 and whether export conditions improve, as management said high fuel and freight costs and trade-related disruptions continued to affect exports.