










Somany working-capital days reach 20 as inventory rises
Key highlights
- Somany’s consolidated working-capital days rose to 20 in September 2026 from 9 in March 2026.
- Consolidated inventories increased Rs 65 crore to Rs 417 crore between March and September 2026.
- Consolidated net debt rose Rs 66 crore to Rs 171 crore, and the net-debt-to-equity ratio increased to 0.19.
- H1FY27 consolidated EBITDA increased 82.8% to Rs 186 crore and EBITDA margin reached 11.6%.
powered by IRIS
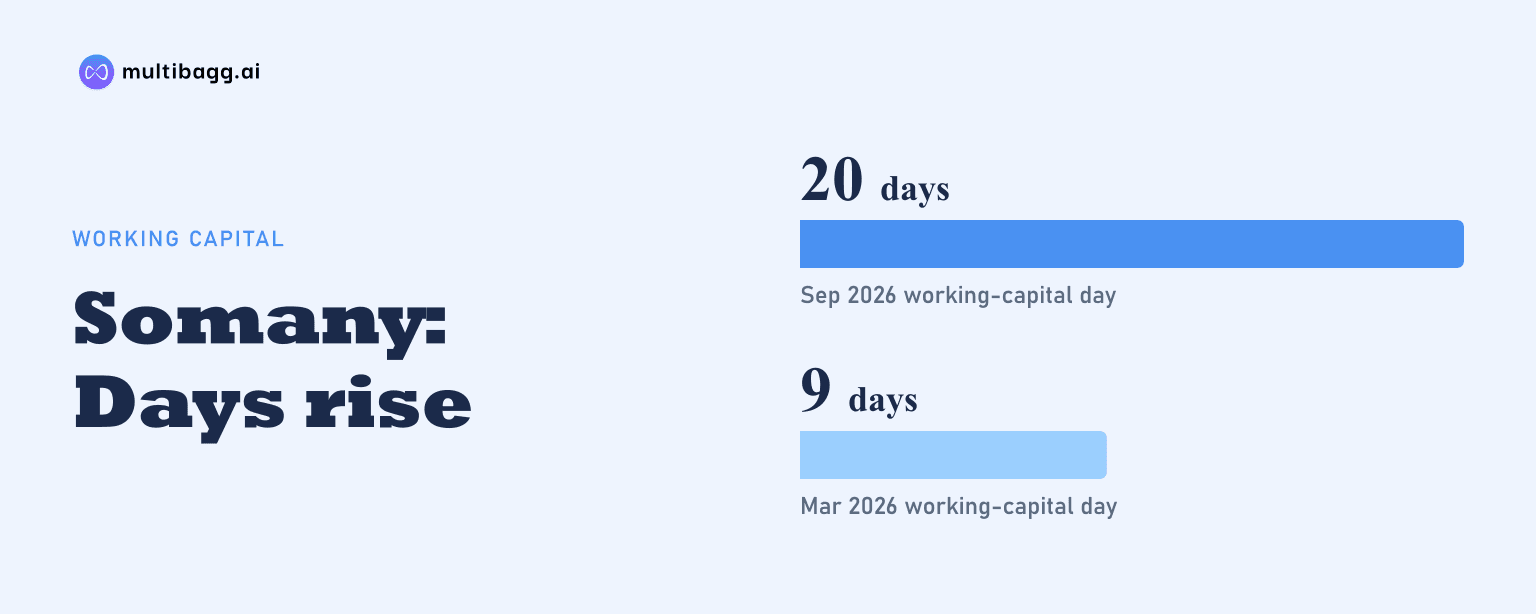
Somany Ceramics Ltd reported consolidated working-capital days of 20 in September 2026, up from 9 in March 2026, as inventories rose Rs 65 crore to Rs 417 crore; consolidated net debt also increased Rs 66 crore to Rs 171 crore despite H1FY27 earnings before interest, tax, depreciation and amortisation (EBITDA) rising 82.8% to Rs 186 crore.
Know Somany Ceramics inside out
Results, valuation, peers and who's buying, in one view.
Why did Somany’s working-capital days reach 20?
Somany’s consolidated working-capital days increased by 11 days to 20 in September 2026 from 9 in March 2026. The presentation calculates this measure excluding investments, cash balance, short-term borrowings and capital creditors. Over the six-month period, inventories rose to Rs 417 crore from Rs 352 crore, debtors declined to Rs 287 crore from Rs 301 crore, and trade payables rose to Rs 402 crore from Rs 334 crore.
The Rs 65 crore rise in inventory was the largest increase among the disclosed operating asset balances, although trade payables increased by a slightly higher Rs 68 crore. The fall of Rs 14 crore in debtors did not prevent the reported working-capital-days measure from rising. Somany does not provide inventory-turnover data or an operating explanation for the inventory increase.
How did Somany’s net debt change by September 2026?
Somany’s consolidated net debt rose to Rs 171 crore in September 2026 from Rs 105 crore in March 2026, while its net-debt-to-equity ratio increased to 0.19 from 0.12. This followed a reduction in net debt to Rs 105 crore in March 2026 from Rs 225 crore in March 2025. The presentation says the September 2026 consolidated net-debt figure includes Rs 25 crore of debt for solar and other energy-related investments.
The consolidated balance sheet shows total debt of Rs 277 crore in H1FY27, compared with Rs 251 crore in FY26, an increase of Rs 26 crore. Current assets rose by Rs 20 crore to Rs 875 crore, while current liabilities declined by Rs 41 crore to Rs 600 crore. Net worth increased Rs 54 crore to Rs 896 crore and total assets increased Rs 47 crore to Rs 2,059 crore.
Somany’s net-debt figure differs from the total-debt line because net debt incorporates balances beyond debt alone. September 2026 net debt of Rs 171 crore remained below the Rs 257 crore reported in March 2024 and Rs 225 crore in March 2025, but was above the March 2026 level. The presentation does not provide a separate reconciliation between total debt and net debt.
How does Somany’s standalone working capital compare?
Somany reported standalone working-capital days of 8 in September 2026, compared with 20 days on a consolidated basis. Standalone working-capital days rose from negative 4 in March 2026, while standalone inventories increased Rs 26 crore to Rs 240 crore. Standalone debtors fell Rs 11 crore to Rs 259 crore and trade payables rose Rs 36 crore to Rs 305 crore.
Standalone net debt was negative Rs 83 crore in September 2026, compared with negative Rs 123 crore in March 2026, and the reported net-debt-to-equity ratio moved to negative 0.09 from negative 0.14. This contrasts with consolidated net debt of Rs 171 crore and a 0.19 ratio. The consolidated inventory balance of Rs 417 crore was Rs 177 crore higher than the standalone inventory balance.
The gap between consolidated and standalone working-capital days was 12 days in September 2026, compared with 13 days in March 2026. At March 2025, the standalone measure was negative 1 day and the consolidated measure was 13 days. The presentation does not allocate the consolidated working-capital difference by subsidiary or joint venture.
Got a follow-up? Ask IRIS
Did Somany’s earnings improve alongside higher working capital?
Yes, Somany’s consolidated H1FY27 sales increased 24.6% to Rs 1,598 crore from Rs 1,282 crore in H1FY26, while EBITDA increased 82.8% to Rs 186 crore from Rs 102 crore. EBITDA margin rose 3.7 percentage points to 11.6% from 7.9%. These are consolidated measures, matching the basis of the working-capital and net-debt figures.
Consolidated profit after tax increased to Rs 76 crore in H1FY27 from Rs 20 crore in H1FY26. Profit after tax attributable to controlling interest rose to Rs 77 crore from Rs 25 crore, while earnings per share increased to Rs 18.78 from Rs 6.18. The presentation reports a Rs 2 crore exceptional-item gain or loss line in H1FY27.
The second quarter recorded the same direction of change. Q2FY27 consolidated sales rose 25.4% to Rs 854 crore from Rs 681 crore in Q2FY26, and EBITDA rose 86.4% to Rs 100 crore from Rs 54 crore. Q2FY27 profit after tax attributable to controlling interest was Rs 42 crore, compared with Rs 15 crore a year earlier.
Which Somany sales segments expanded in H1FY27?
Somany recorded higher H1FY27 sales across all five disclosed categories, with own manufacturing producing the largest absolute increase. Own-manufacturing sales rose Rs 132.71 crore to Rs 482.08 crore from Rs 349.37 crore. Joint-venture tile sales increased Rs 78.98 crore to Rs 431.26 crore, while outsourced tile sales rose Rs 61.77 crore to Rs 441.95 crore.
Bathware sales increased Rs 25 crore to Rs 164.32 crore in H1FY27 from Rs 139.32 crore in H1FY26, and other sales rose Rs 17.27 crore to Rs 78.12 crore. Total disclosed sales increased Rs 315.73 crore to Rs 1,597.73 crore, close to the Rs 1,598 crore consolidated sales reported in the profit-and-loss statement because the sales-performance table uses more precision. The presentation does not assign the Rs 65 crore inventory rise to any individual sales category.
Somany also reported return on capital employed of 23.8% in Q2FY27, compared with 20.4% in Q1FY27 and 13.7% in March 2026. Return on equity was 18.9% in Q2FY27, compared with 16.7% in Q1FY27 and 10.1% in March 2026. These reported return measures rose during the period in which H1FY27 EBITDA reached Rs 186 crore.
Conclusion
Somany’s September 2026 data show higher consolidated profitability alongside a longer reported working-capital cycle and higher net debt. H1FY27 EBITDA increased Rs 84 crore to Rs 186 crore, while working-capital days increased to 20 and inventories rose Rs 65 crore from March 2026. Debtors fell, but the disclosed changes in inventory and payables accompanied a net-debt increase to Rs 171 crore.
The next disclosed development to watch is Somany’s proposed joint-venture tile plant at Tirupati, Andhra Pradesh, with capacity of more than 9 million square metres. As of September 30, 2026, Somany listed 8.40 million square metres of joint-venture tile capacity in Tirupati, but the presentation gives no completion date for the proposed plant or allocation of its funding.