










SPCON income more than tripled as FY26 EBITDA margin doubled
Key highlights
- SPCON’s total income increased from Rs 26.35 crore in FY23 to Rs 90.3024 crore in FY26.
- SPCON’s FY26 EBITDA margin reached 16.68%, compared with 8.16% in FY23.
- SPCON’s FY26 PAT rose 24.6% to Rs 8.2102 crore while total income grew 0.6%.
- SPCON’s debt-to-equity ratio fell to 0.37 times in FY26 from 1.12 times in FY25.
powered by IRIS
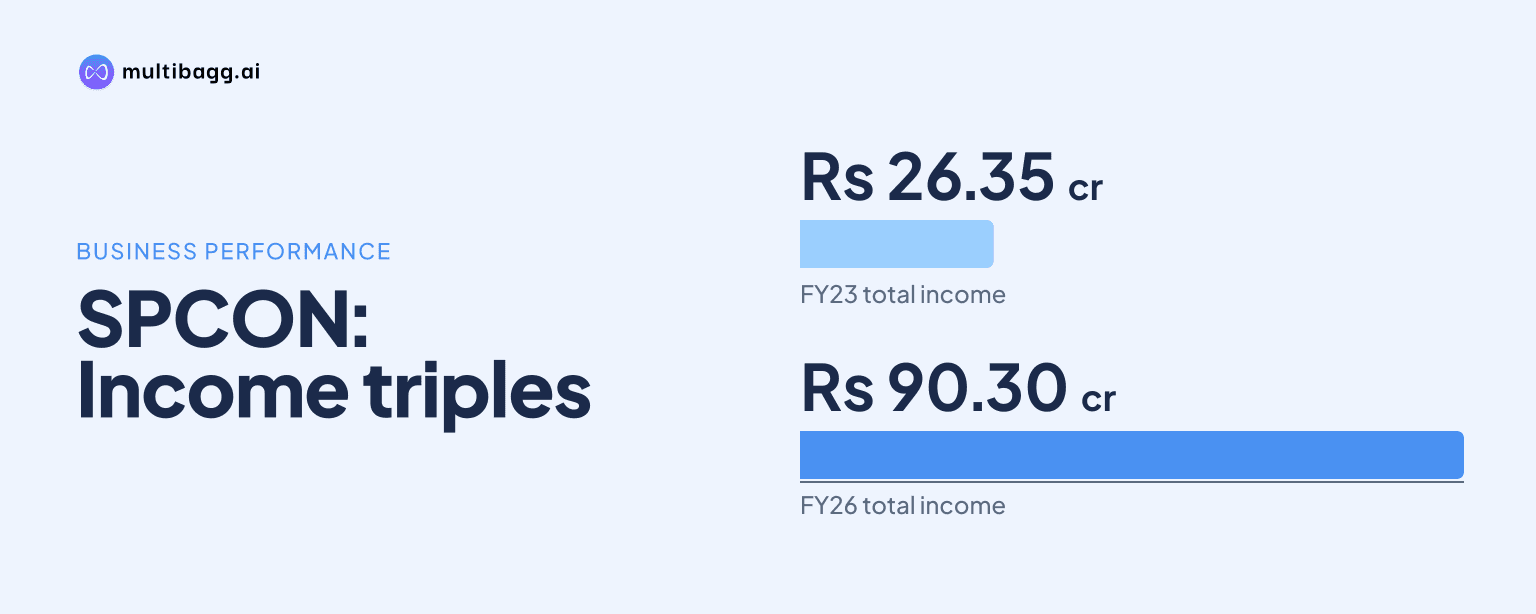
SPCON increased total income from Rs 26.35 crore in FY23 to Rs 90.3024 crore in FY26, while EBITDA margin rose from 8.16% to 16.68%. The record shows that income expanded at a reported 50.7% compound annual growth rate, or CAGR, and FY26 profitability improved even though income increased only 0.6% from FY25.
Know Srinibas Pradhan Constructions inside out
Results, valuation, peers and who's buying, in one view.
How much did SPCON’s income grow between FY23 and FY26?
SPCON’s total income more than tripled between FY23 and FY26, rising by Rs 63.9524 crore from Rs 26.35 crore to Rs 90.3024 crore. The presentation reports a 50.7% CAGR across the FY23-FY26 period, with income reaching Rs 35.27 crore in FY24 and Rs 89.73 crore in FY25 before the FY26 result.
The largest annual increase occurred in FY25, when total income rose from Rs 35.27 crore in FY24 to Rs 89.73 crore. FY26 represented a different growth pattern: income was 0.6% above FY25’s Rs 89.7258 crore, which management described as broadly flat revenue after FY25’s near-2.5 times jump.
The FY26 total included Rs 90.213 crore of revenue and Rs 8.94 lakh of other income, compared with FY25 revenue of Rs 89.6847 crore and other income of Rs 4.11 lakh. That composition shows that reported FY26 income growth came principally from revenue, while other income also increased from the preceding year.
Did SPCON’s profitability improve as its income increased?
SPCON’s operating profitability improved over the four years, with EBITDA rising from Rs 2.15 crore in FY23 to Rs 15.07 crore in FY26 and EBITDA margin increasing from 8.16% to 16.68%. The presentation reports a 91.4% EBITDA CAGR, which exceeded the reported 50.7% income CAGR over FY23-FY26.
The margin improvement was not uniform across each year. EBITDA margin was 15.81% in FY24, declined to 14.54% in FY25, and then increased by 214 basis points to 16.68% in FY26. A basis point is one-hundredth of a percentage point, so the FY26 movement was a 2.14-percentage-point increase from FY25.
Profit after tax, or PAT, followed a similar pattern in absolute terms, increasing from Rs 1.48 crore in FY23 to Rs 8.21 crore in FY26. PAT margin rose from 5.62% in FY23 to 9.09% in FY26, although it was 10.06% in FY24 and 7.34% in FY25, indicating that the FY26 recovery did not take the net margin above its FY24 level.
Got a follow-up? Ask IRIS
Why did SPCON’s FY26 profit grow faster than income?
SPCON said improved project execution, operational efficiencies and disciplined cost management lifted FY26 EBITDA by 15.5% and PAT by 24.6%, despite total income growing 0.6%. EBITDA increased to Rs 15.0653 crore in FY26 from Rs 13.005 crore in FY25, while PAT rose to Rs 8.2102 crore from Rs 6.5884 crore.
The FY26 EBITDA margin increased to 16.68% from 14.54% in FY25, while PAT margin increased by 175 basis points to 9.09% from 7.34%. These margin changes explain why reported profit growth outpaced the change in total income during a year when the revenue base was largely unchanged.
Diluted earnings per share were Rs 13.33 in FY26, up 17.6% from Rs 11.34 in FY25 on a bonus-adjusted basis. SPCON also reported a 28.8% FY26 return on average equity, while management said the March 2026 initial public offering, or IPO, recapitalised the balance sheet for the next stage of growth.
What did SPCON’s FY26 balance sheet and cash flow show?
SPCON ended FY26 with total equity of Rs 41.1024 crore, compared with Rs 15.9026 crore in FY25, while total debt declined to Rs 15.26 crore from Rs 17.75 crore. The presentation consequently shows debt to equity at 0.37 times in FY26, down from 1.12 times a year earlier.
Cash and bank balance rose to Rs 7.1397 crore at 31 March 2026 from Rs 1.1222 crore at FY25 end. Total assets increased to Rs 80.3825 crore from Rs 55.7572 crore, including trade receivables of Rs 38.4075 crore and inventories of Rs 16.1647 crore, which SPCON said reflected the engineering, procurement and construction execution cycle.
Cash flow from operating activities remained negative at Rs 5.0943 crore in FY26, compared with negative Rs 13.7875 crore in FY25. Cash flow from financing activities was positive at Rs 13.5051 crore in FY26, and net cash and cash equivalents increased by Rs 6.6565 crore during the year.
Conclusion
SPCON’s FY23-FY26 financial record combines substantial scale growth with a higher operating margin. Total income rose from Rs 26.35 crore to Rs 90.3024 crore, EBITDA rose from Rs 2.15 crore to Rs 15.07 crore, and the EBITDA margin more than doubled to 16.68%. FY26 differed from FY25 because profitability increased despite broadly flat income.
The next disclosed items to watch are execution and working-capital use in FY27. SPCON earmarked Rs 6.55 crore of IPO proceeds for further working-capital funding into FY27, while H1 FY27 total income declined 13.88% to Rs 39.2966 crore amid costlier and inconsistent bitumen supply, even as EBITDA margin increased to 22.81%.