










Spectraa H1 revenue rises 19.6% as profit growth slows to 5%
Key highlights
- Spectraa's H1 FY 26-27 revenue from operations rose 19.62% to Rs 40.1047 crore.
- Spectraa's H1 FY 26-27 profit after tax rose 5.04% to Rs 4.6355 crore.
- Spectraa's cost of materials consumed increased 50.70% to Rs 18.5279 crore in H1 FY 26-27.
- Spectraa reported an unexecuted order book of Rs 106.2132 crore, with 85.67% in commercial breweries.
powered by IRIS
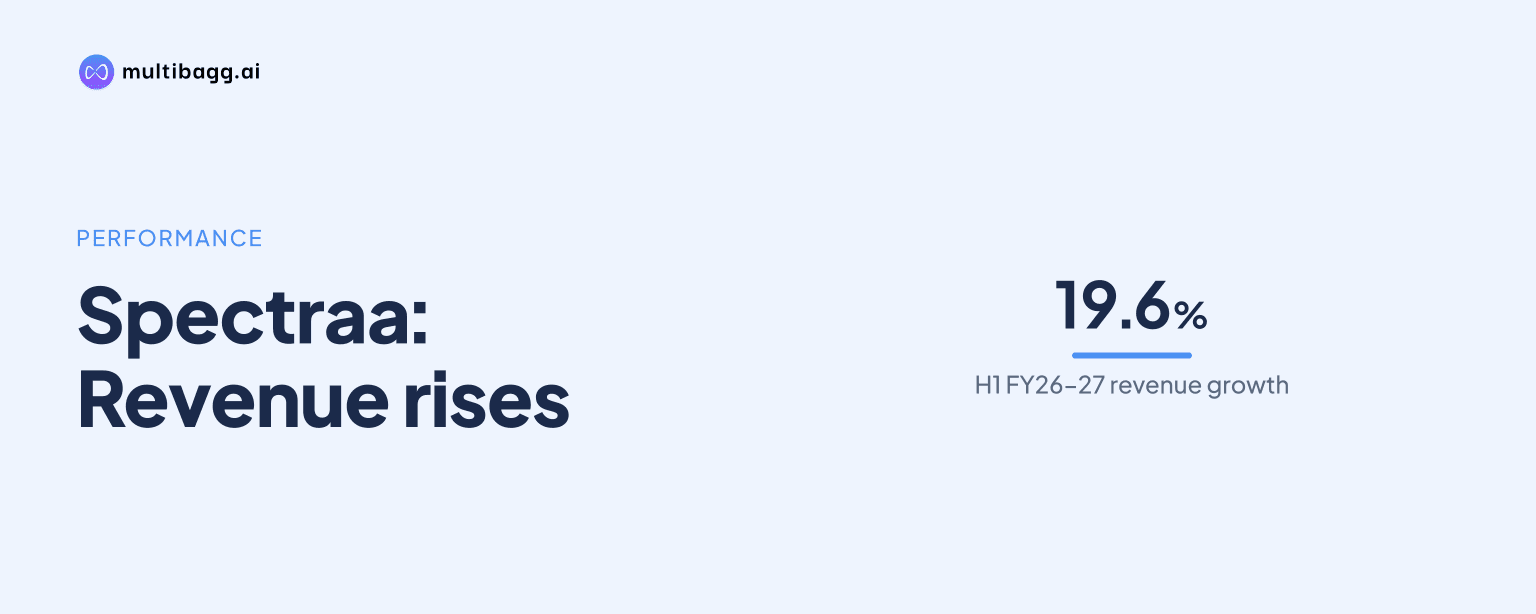
Spectraa Technology Solutions Limited reported revenue from operations of Rs 40.1047 crore in H1 FY 26-27, up 19.62% year on year, while profit after tax rose 5.04% to Rs 4.6355 crore as material costs, finance costs and depreciation increased faster than sales.
Know SpectraA Technology Solutions inside out
Results, valuation, peers and who's buying, in one view.
What drove Spectraa's H1 FY 26-27 revenue growth?
Spectraa's revenue from operations increased by Rs 6.5766 crore to Rs 40.1047 crore in H1 FY 26-27 from Rs 33.5281 crore in H1 FY 25-26. Other income rose 9.35% to Rs 0.6431 crore from Rs 0.5881 crore, while full-year FY 25-26 revenue from operations was Rs 101.1621 crore. The presentation does not disclose a revenue forecast or target for the remainder of FY 26-27.
Commercial Brewery, IMFL and Blending generated 96.10% of H1 revenue, making it Spectraa's largest vertical in the period. Food and Beverages contributed 1.22%, Craft and Microbrewery contributed 0.83%, and freight, installation, scrap and other revenue contributed 1.84%. Exports generated Rs 21.76 crore, or 54.25% of revenue, compared with domestic revenue of Rs 18.35 crore, or 45.75%.
Why did Spectraa's profit grow slower than revenue?
Spectraa's profit after tax increased by Rs 0.2224 crore, compared with a Rs 6.5766 crore increase in operating revenue, because material consumption and employee costs rose faster than sales. Cost of materials consumed increased 50.70% to Rs 18.5279 crore from Rs 12.2942 crore, while employee benefits expense rose 24.50% to Rs 8.8958 crore from Rs 7.1454 crore.
Changes in inventories of work-in-progress moved to negative Rs 0.6771 crore in H1 FY 26-27 from positive Rs 2.5812 crore a year earlier. Other expenses increased 16.32% to Rs 4.5495 crore from Rs 3.9111 crore. Earnings before interest, tax, depreciation and amortisation, or EBITDA, consequently grew 15.49% to Rs 9.4517 crore, slower than the 19.62% rise in operating revenue.
How did finance costs and depreciation affect Spectraa's earnings?
Spectraa's finance costs rose 25.21% to Rs 2.1560 crore in H1 FY 26-27 from Rs 1.7219 crore in H1 FY 25-26, an increase of Rs 0.4341 crore. This increase exceeded the growth rate in EBITDA and revenue, contributing to profit before tax rising only 4.27% to Rs 6.2444 crore from Rs 5.9887 crore.
Depreciation and amortisation increased 121.96% to Rs 1.0513 crore from Rs 0.4736 crore, adding Rs 0.5777 crore year on year. Finance costs and depreciation together rose by Rs 1.0118 crore, while profit before tax increased by Rs 0.2557 crore. The shareholder letter does not provide an asset-level explanation for the depreciation increase or details of borrowing arrangements behind the higher finance costs.
Tax expense, including current and deferred tax, rose to Rs 1.6090 crore in H1 FY 26-27 from Rs 1.5755 crore in H1 FY 25-26. After that Rs 0.0335 crore increase in tax expense, profit after tax reached Rs 4.6355 crore, compared with Rs 4.4131 crore a year earlier. The reported progression shows that earnings growth slowed both at the EBITDA level and below it.
Got a follow-up? Ask IRIS
What was Spectraa's revenue mix and order-book position?
Spectraa's export share reached 54.25% of H1 FY 26-27 revenue, up from 29.38% in FY 25-26. Export revenue of Rs 21.76 crore exceeded domestic revenue of Rs 18.35 crore during the half. The revenue mix was therefore more export-led in H1 than the full-year FY 25-26 export share disclosed in the presentation.
Spectraa reported an unexecuted order book of Rs 106.2132 crore, based on its invoicing and order report dated September 30, 2026 and excluding goods and services tax. Domestic orders accounted for Rs 64.0969 crore, or 60.35%, while export orders accounted for Rs 42.1163 crore, or 39.65%. The order-book geography was therefore more domestic than the H1 revenue geography.
Commercial breweries represented Rs 90.9906 crore, or 85.67%, of the order book, compared with Rs 9.6534 crore in distillery orders, Rs 4.0392 crore in microbrewery orders and Rs 1.5300 crore in Food and Beverages orders. The total includes seven orders worth Rs 23.96 crore booked from October 1 to November 7, 2026. Spectraa identified a Rs 21.07 crore Pure Spirits Brewery commercial-brewery order dated November 7 as its highest single order.
How did Spectraa's debt and equity measures change?
Spectraa reported net debt of Rs 2.88 crore, down from Rs 23.61 crore at September 2025, alongside cash of Rs 26.50 crore. Its debt-to-equity ratio was 0.43 times, compared with 1.40 times at September 2025. The presentation reports these balance-sheet measures separately from the H1 profit and loss statement.
Spectraa reported net worth of Rs 67.88 crore, which management described as 3.86 times the September 2025 level. The reduction in reported net debt contrasts with H1 finance costs rising 25.21% to Rs 2.1560 crore. The presentation does not reconcile the debt movement to cash flows, state the timing of borrowings or repayments, or disclose the interest rates underlying the finance-cost increase.
Conclusion
Spectraa's H1 FY 26-27 result combined 19.62% operating-revenue growth with slower earnings growth as materials consumption rose 50.70%, finance costs increased 25.21% and depreciation and amortisation increased 121.96%. Commercial Brewery, IMFL and Blending accounted for 96.10% of revenue, while exports supplied 54.25% of the half-year total.
The next disclosed execution measure is the Rs 106.2132 crore unexecuted order book, including Rs 90.9906 crore in commercial breweries and Rs 23.96 crore of seven orders booked between October 1 and November 7, 2026. Spectraa has not disclosed an order-book delivery schedule or the reasons for higher depreciation and finance costs, leaving subsequent disclosures to show how backlog conversion affects costs and earnings.