










Stallion EBITDA margin reaches 14.13% as PAT nearly triples
Key highlights
- Stallion’s EBITDA margin rose to 14.13% in FY 25-26 from 11.37% in FY 23-24.
- Stallion’s FY 25-26 PAT was Rs 43.84 crore, compared with Rs 15.47 crore in FY 23-24.
- Stallion reported H1 FY27 operating EBITDA before ESOP expense of Rs 41.10 crore, up 36.39% year on year.
- Stallion expects the 10,000 metric tonne R-32 facility to be commissioned in March 2027.
powered by IRIS
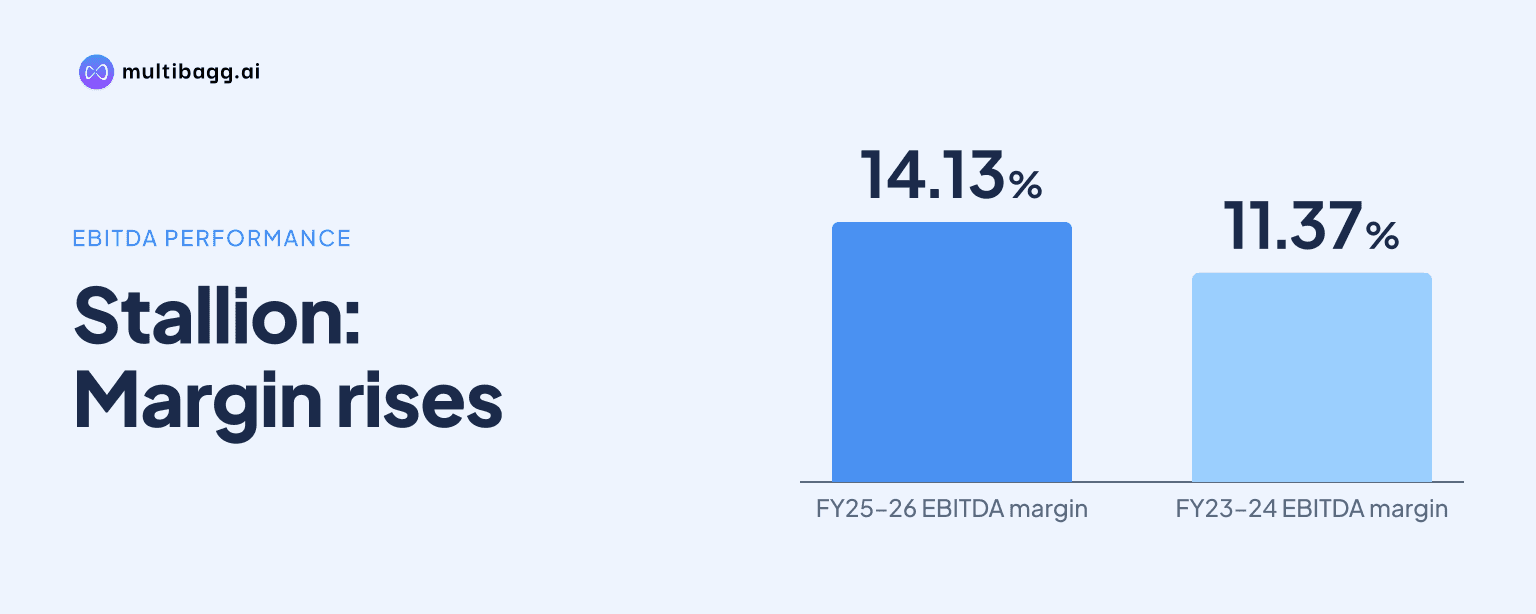
Stallion raised its EBITDA margin to 14.13% in FY 25-26 from 11.37% in FY 23-24, while profit after tax reached Rs 43.84 crore from Rs 15.47 crore. Total income increased 83.77% over the two years, but EBITDA rose 128.48% and PAT rose 183.37%, indicating faster earnings growth than income growth.
Know Stallion India Fluorochemicals inside out
Results, valuation, peers and who's buying, in one view.
How did Stallion’s annual earnings change over three years?
Stallion’s annual total income increased to Rs 434.12 crore in FY 25-26 from Rs 236.23 crore in FY 23-24, while EBITDA, or earnings before interest, tax, depreciation and amortisation, rose to Rs 61.35 crore from Rs 26.85 crore. PAT, or profit after tax, rose to Rs 43.84 crore from Rs 15.47 crore over the same period. The annual profit and loss statement reports no exceptional item in FY 23-24, FY 24-25 or FY 25-26.
Stallion’s growth rate slowed in FY 25-26 after the larger FY 24-25 increase, but earnings still rose faster than income. Total income grew 60.64% in FY 24-25 and 14.40% in FY 25-26; EBITDA grew 85.25% and 23.34%, respectively. PAT increased 108.91% in FY 24-25 and 35.61% in FY 25-26, taking FY 25-26 PAT to about 2.83 times the FY 23-24 level.
Did Stallion’s annual margins expand faster than income?
Yes, Stallion’s EBITDA margin increased by 2.76 percentage points, to 14.13% in FY 25-26 from 11.37% in FY 23-24, while PAT margin rose by 3.55 percentage points to 10.10%. Both measures rose in each of the three reported financial years: EBITDA margin was 13.11% in FY 24-25 and PAT margin was 8.52% that year.
The reported figures show total income increasing by Rs 197.90 crore between FY 23-24 and FY 25-26, compared with a Rs 34.50 crore increase in EBITDA and a Rs 28.37 crore increase in PAT. Total income in FY 25-26 was about 1.84 times its FY 23-24 level, below the 2.83 times multiple for PAT. The presentation does not provide a product, customer or end-market profitability split to quantify which gases or activities contributed to the margin change.
What changed in Stallion’s annual cost and financing lines?
Stallion’s raw-material expense increased to Rs 345.14 crore in FY 25-26 from Rs 186.75 crore in FY 23-24, while employee costs rose to Rs 9.48 crore from Rs 1.91 crore. Other expenses declined to Rs 18.16 crore from Rs 20.72 crore, even as total expenditure increased to Rs 372.78 crore from Rs 209.38 crore over the two years.
Below EBITDA, Stallion’s finance costs fell to Rs 0.89 crore in FY 25-26 from Rs 4.15 crore in FY 23-24, while depreciation rose to Rs 1.48 crore from Rs 1.11 crore. Profit before tax increased to Rs 58.98 crore from Rs 21.59 crore, and tax expense increased to Rs 15.14 crore from Rs 6.12 crore. The annual statement records these changes but does not assign a quantified share of the margin expansion to any individual expense line.
Got a follow-up? Ask IRIS
How do Stallion’s latest quarterly results compare?
Stallion reported Q2 FY27 total income of Rs 139.37 crore, up 31.79% from Rs 105.76 crore in Q2 FY26, while reported EBITDA fell 59.88% to Rs 6.33 crore. The Q2 FY27 results include a Rs 9.51 crore employee stock option plan, or ESOP, expense. Operating EBITDA before that ESOP provision was Rs 15.84 crore, compared with Rs 15.77 crore in Q2 FY26, a 0.43% increase.
For H1 FY27, Stallion reported total income of Rs 264.05 crore, 22.07% above Rs 216.30 crore in H1 FY26. Reported EBITDA rose 4.83% to Rs 31.59 crore, while operating EBITDA before the ESOP provision rose 36.39% to Rs 41.10 crore. Reported PAT declined 3.50% to Rs 21.02 crore, whereas operating PAT before the ESOP provision increased 40.16% to Rs 30.53 crore; the presentation says the non-cash, equity-settled ESOP charge is recognised under Ind AS 102.
What plans does Stallion disclose for future profitability?
Stallion says it expects 30-35% compound annual growth over the next three years while maintaining sustainable margins. Management also says backward integration and higher-value products, including semiconductor gases, could enhance profitability by 3-4%. These are management expectations, rather than reported results, and the presentation also lists specialty gas expansion, an HFO/HFC blending and HFO debulking facility at Mambattu, and the operational Khalapur high-purity helium facility.
Stallion’s most specific project is the proposed 10,000 metric tonne per annum R-32 manufacturing facility at Ukhaliya in Bhilwara, Rajasthan. Environmental clearance was granted on 28 December 2025 and is valid for 10 years, while construction has commenced and commissioning is expected in March 2027. Management estimates Rs 500-600 crore of topline potential in FY27-28 and a 22% PAT margin; the project also includes 7,500 metric tonnes per annum of aggregate blended-refrigerant capacity and hydrochloric acid as a 30% by-product.
Conclusion
Stallion’s FY 23-24 to FY 25-26 results show income growth alongside a widening earnings spread: total income rose to Rs 434.12 crore, EBITDA reached Rs 61.35 crore and PAT reached Rs 43.84 crore. EBITDA margin increased from 11.37% to 14.13%, while PAT margin rose from 6.55% to 10.10%, with profit growth exceeding the increase in total income.
The next reported results will show whether H1 FY27 operating measures, which exclude Rs 9.51 crore of ESOP expense, translate into reported earnings. Execution of the R-32 facility is also a disclosed point to watch, with commissioning expected in March 2027 and management estimating Rs 500-600 crore of FY27-28 topline potential for the project.