










Takyon Networks swings to Rs 8.4534 crore H1 FY27 net loss
Key highlights
- Takyon Networks reported an Rs 8.4534 crore loss in H1 FY27 versus an Rs 3.2183 crore profit in H1 FY26.
- Revenue from operations fell 27.3% year on year to Rs 30.6139 crore in H1 FY27.
- Gross margin moved to negative 1.91% in H1 FY27 from 37.11% in H1 FY26.
- Management cited a current order book of Rs 46.65 crore for the coming quarters.
powered by IRIS
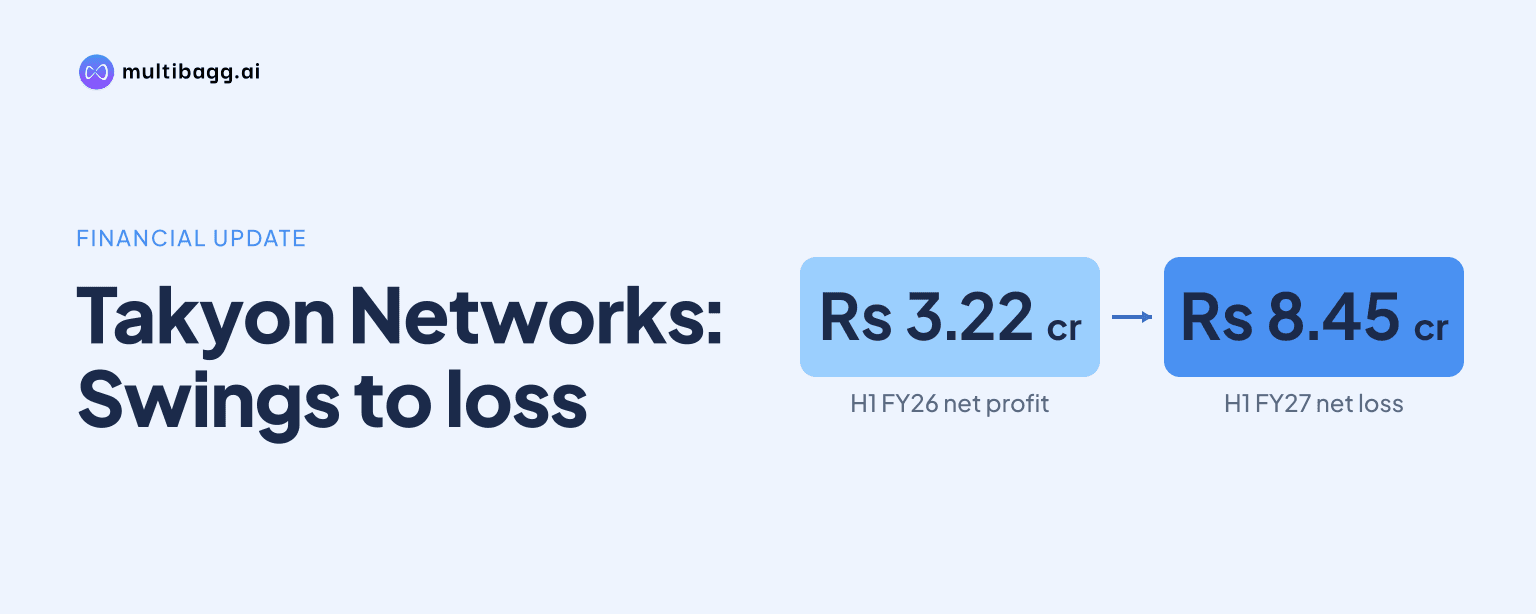
Takyon Networks Limited posted an Rs 8.4534 crore net loss in H1 FY27, versus an Rs 3.2183 crore profit in H1 FY26, as gross margin fell to negative 1.91% from 37.11%. Revenue from operations declined to Rs 30.6139 crore, while cost of goods sold exceeded sales by Rs 88.85 lakh.
Know Takyon Networks inside out
Results, valuation, peers and who's buying, in one view.
Why did Takyon Networks report a loss in H1 FY27?
Takyon Networks reported a loss because cost of goods sold exceeded revenue and operating expenses remained substantial. Management said extended project timelines, rising input costs and contractual limitations affected H1 FY27 performance. Cost of goods sold was Rs 31.5024 crore against revenue from operations of Rs 30.6139 crore, producing a gross loss of Rs 59.10 lakh.
The gross loss was followed by Rs 7.3544 crore of operating and other expenses, resulting in negative earnings before interest, tax, depreciation and amortisation, or EBITDA, of Rs 7.9454 crore. In H1 FY26, Takyon Networks had reported gross profit of Rs 15.7786 crore and EBITDA of Rs 5.4821 crore. Operating and other expenses declined from Rs 10.2966 crore a year earlier, so the reported change in gross profitability was the larger movement between the two half-years.
Depreciation and amortisation fell to Rs 7.08 lakh in H1 FY27 from Rs 34.33 lakh in H1 FY26, while interest cost declined to Rs 43.80 lakh from Rs 1.0462 crore. These lower charges did not offset the operating loss. Profit before tax was negative Rs 8.4543 crore, compared with a profit of Rs 4.0926 crore a year earlier, and total tax expense was a Rs 0.09 lakh credit.
How did Takyon Networks revenue and gross margin change?
Takyon Networks' H1 FY27 revenue from operations fell to Rs 30.6139 crore from Rs 42.0829 crore in H1 FY26, while gross margin fell 39.02 percentage points to negative 1.91%. Revenue was above the Rs 28.3442 crore recorded in H2 FY26, but H2 FY26 gross margin was 27.58%.
Other income declined to Rs 29.75 lakh in H1 FY27 from Rs 43.78 lakh in H1 FY26 and Rs 1.1806 crore in H2 FY26. Total income therefore declined to Rs 30.9114 crore from Rs 42.5207 crore year on year. Cost of goods sold increased from Rs 26.7421 crore in H1 FY26 despite the lower revenue base in H1 FY27.
In H1 FY26, cost of goods sold was Rs 15.3408 crore below revenue from operations, supporting a 37.11% gross margin. In H2 FY26, the gap was Rs 6.9625 crore and gross margin was 27.58%. In H1 FY27, cost of goods sold was Rs 88.85 lakh above revenue, resulting in the negative gross margin.
Which earnings measures reversed for Takyon Networks?
Takyon Networks' profit after tax reversed to an Rs 8.4534 crore loss in H1 FY27 from an Rs 3.2183 crore profit in H1 FY26. Profit-after-tax margin changed to negative 27.35% from positive 7.57%, while earnings per share changed to negative Rs 5.90 from positive Rs 2.25.
The result was also weaker than H2 FY26, when Takyon Networks reported an Rs 18.26 lakh loss and negative earnings per share of Rs 0.16. EBITDA margin was negative 25.95% in H1 FY27, compared with 2.75% in H2 FY26 and 12.89% in H1 FY26. The H1 FY27 operating and other expense figure of Rs 7.3544 crore was close to Rs 7.3643 crore in H2 FY26.
Profit before tax was negative Rs 8.4543 crore in H1 FY27, compared with negative Rs 32.24 lakh in H2 FY26. H1 FY27 revenue was Rs 2.2697 crore above H2 FY26 revenue, yet the pre-tax loss was larger. The reported figures indicate that the change in cost of goods sold relative to sales, rather than revenue alone, determined the difference in earnings between those periods.
Got a follow-up? Ask IRIS
What changed on Takyon Networks' balance sheet?
Takyon Networks' total equity declined to Rs 45.9019 crore at H1 FY27 from Rs 54.3553 crore at FY26. Share capital was unchanged at Rs 14.3220 crore, while reserves and surplus declined to Rs 31.5799 crore from Rs 40.0333 crore, a movement broadly corresponding with the Rs 8.4534 crore H1 FY27 loss.
Total liabilities increased to Rs 20.5258 crore at H1 FY27 from Rs 12.8476 crore at FY26. Short-term borrowings rose by Rs 3.00 crore to Rs 9.5485 crore, trade payables increased to Rs 7.3384 crore from Rs 4.6463 crore, and other current liabilities rose to Rs 2.1135 crore from Rs 49.38 lakh. Long-term borrowings were unchanged at Rs 45.00 lakh.
Total assets were Rs 66.4278 crore at H1 FY27, compared with Rs 67.2030 crore at FY26. Trade receivables declined to Rs 30.3782 crore from Rs 36.0560 crore, inventories edged down to Rs 6.0067 crore from Rs 6.0999 crore, and cash and cash equivalents increased to Rs 20.28 lakh from Rs 15.40 lakh. Other current assets rose to Rs 5.6266 crore from Rs 3.0763 crore.
What does Takyon Networks expect for H2 FY27?
Takyon Networks management said it expects improved H2 FY27 performance from project execution and operational efficiencies, supported by a current order book of Rs 46.65 crore. Management did not provide numerical guidance for H2 FY27 revenue, EBITDA, margin or profit.
Management said its priorities are disciplined project selection, timely execution, cost optimisation and strengthening margins. These actions address the H1 FY27 factors it identified, including extended project timelines, rising input costs and contractual limitations. The presentation does not disclose the timing, project mix or expected margin of the Rs 46.65 crore order book.
Takyon Networks presents capabilities in information technology, networking, cybersecurity, surveillance and information and communications technology solutions. It identifies original equipment manufacturer relationships with Juniper, Dell, Sophos and Nokia, with customers spanning government, defence, railways, banking, financial services and insurance, education and corporate sectors. The presentation does not quantify H1 FY27 revenue or profitability by product or customer segment.
Conclusion
Takyon Networks' H1 FY27 earnings reversal combined a Rs 11.4684 crore year-on-year decline in revenue with a Rs 4.7603 crore increase in cost of goods sold. That shift moved gross margin from 37.11% to negative 1.91%, generated an Rs 8.4534 crore net loss and reduced total equity to Rs 45.9019 crore from Rs 54.3553 crore at FY26.
The next reported period will show whether management's stated plan for project selection, execution, cost optimisation and margin strengthening changes the relationship between sales and cost of goods sold. Progress against the Rs 46.65 crore current order book, and whether its projects are executed without the H1 FY27 timing and cost constraints, is the disclosed matter to watch in H2 FY27.