










Standard Engineering Q2 Revenue Rises 62.3%, PAT Margin Falls
Key highlights
- Standard Engineering Q2FY27 revenue rose 62.3% year on year to Rs 296.6 crore.
- Q2FY27 EBITDA excluding other income increased 79.7% to Rs 51.4 crore and margin reached 17.3%.
- Q2FY27 PAT rose 37.9% to Rs 28.2 crore, while PAT margin declined to 9.5% from 10.9%.
- H1FY27 operating cash flow was Rs 61.0 crore, compared with Rs 45.3 crore for FY26.
powered by IRIS
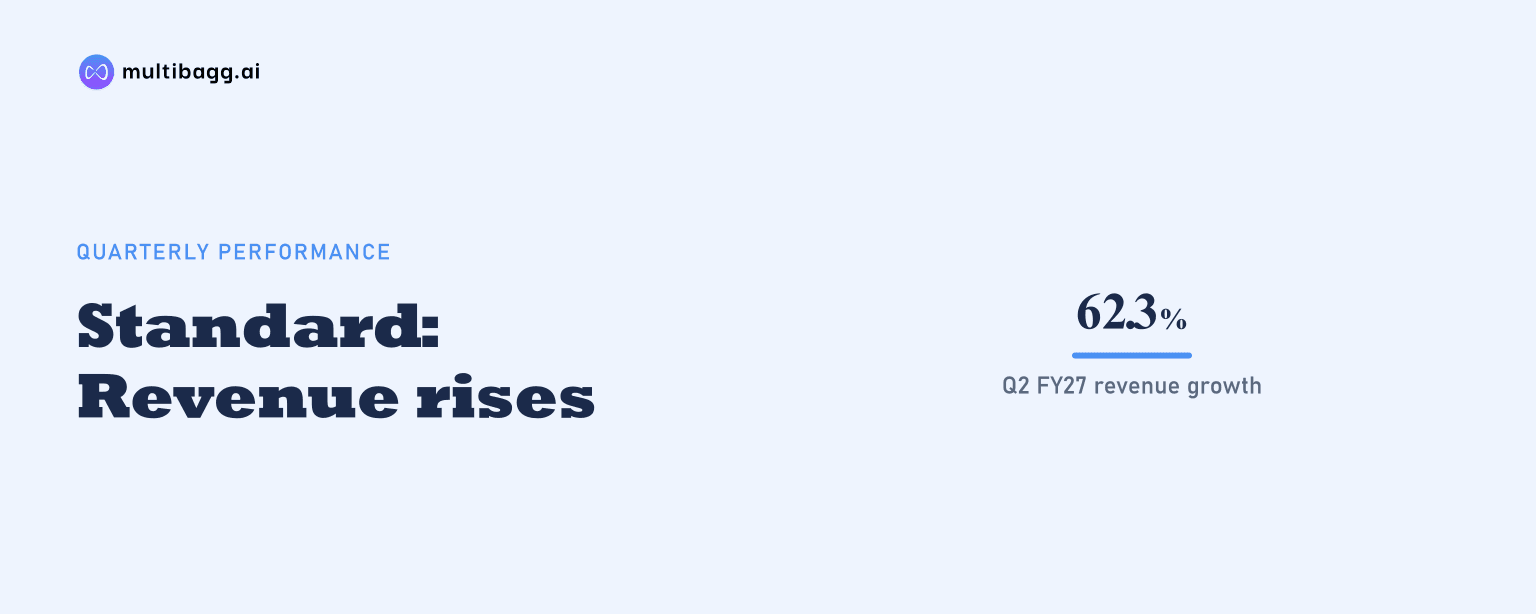
Standard Engineering Technology Limited reported Q2FY27 revenue of Rs 296.6 crore, up 62.3% year on year, while EBITDA margin expanded to 17.3% from 15.7%; profit after tax margin, however, declined to 9.5% from 10.9% as below-EBITDA charges and an associate loss increased.
Know Standard Engineering Technology inside out
Results, valuation, peers and who's buying, in one view.
Why did Standard Engineering’s Q2FY27 revenue rise 62.3%?
Standard Engineering’s Q2FY27 total revenue rose 62.3% year on year to Rs 296.6 crore from Rs 182.8 crore in Q2FY26, and increased 19.7% from Rs 247.7 crore in Q1FY27. Management attributed the increase to higher execution, an expanded product portfolio and healthy demand. Revenue from operations was also Rs 296.6 crore, the same as reported total revenue for the quarter.
Revenue rose for five consecutive quarters, moving from Rs 173 crore in Q1FY26 to Rs 183 crore in Q2FY26, Rs 192 crore in Q3FY26, Rs 227 crore in Q4FY26, Rs 248 crore in Q1FY27 and Rs 297 crore in Q2FY27. For H1FY27, total revenue was Rs 544.3 crore, up 53.0% from Rs 355.9 crore in H1FY26. The H1FY27 figure is a six-month result, while FY26 revenue was Rs 774 crore for the full year.
How did Standard Engineering’s operating profitability change in Q2FY27?
Standard Engineering’s earnings before interest, tax, depreciation and amortisation, or EBITDA, excluding other income, increased 79.7% to Rs 51.4 crore in Q2FY27 from Rs 28.6 crore in Q2FY26. EBITDA grew faster than revenue, taking its margin to 17.3% from 15.7%, an increase of 1.6 percentage points. Total expenditure rose 59.0% to Rs 245.2 crore, below the 62.3% increase in revenue.
Sequentially, Q2FY27 EBITDA increased 29.8% from Rs 39.6 crore in Q1FY27, while the margin rose from 16.0% to 17.3%. H1FY27 EBITDA reached Rs 91.0 crore, up 56.5% from Rs 58.2 crore in H1FY26, and the half-year margin increased to 16.7% from 16.3%. Management said operating leverage from revenue growth was partly offset by higher employee and other operating costs.
Got a follow-up? Ask IRIS
Why did Standard Engineering’s PAT margin decline despite EBITDA growth?
Standard Engineering’s profit after tax, or PAT, rose 37.9% to Rs 28.2 crore in Q2FY27 from Rs 20.4 crore a year earlier, but its growth rate was below the 79.7% EBITDA increase. PAT margin therefore declined to 9.5% from 10.9% in Q2FY26 and from 10.6% in Q1FY27. Profit before tax increased 41.4% to Rs 39.2 crore, compared with Rs 27.7 crore in Q2FY26.
Depreciation was Rs 5.4 crore in Q2FY27, up from Rs 3.9 crore in Q2FY26, while interest increased to Rs 5.2 crore from Rs 2.5 crore. Tax rose to Rs 11.0 crore from Rs 7.3 crore, and Standard Engineering recorded a Rs 1.9 crore share of loss from an associate, with no comparable prior-year amount shown. Other income was negative Rs 0.3 crore compared with negative Rs 5.4 crore a year earlier; EBITDA excludes other income.
The half-year numbers showed a similar difference between operating and net-profit growth. H1FY27 PAT rose 32.2% to Rs 54.9 crore from Rs 41.6 crore, while EBITDA rose 56.5% to Rs 91.0 crore. PAT margin was 10.0%, down from 11.3% in H1FY26. H1FY27 depreciation was Rs 10.4 crore, interest was Rs 8.3 crore, tax was Rs 20.3 crore and the associate loss was Rs 1.9 crore.
What did Standard Engineering’s revenue mix and cash flow show?
Standard Engineering remained primarily exposed to pharmaceuticals in Q2FY27, although chemicals accounted for a larger portion of revenue than a year earlier. Pharmaceuticals represented 70% of Rs 297 crore of revenue, compared with 81% of Rs 183 crore in Q2FY26. Chemicals rose to 20% from 12%, while other end markets increased to 10% from 7%.
Domestic business contributed 97% of Q2FY27 revenue and exports contributed 3%, compared with 98% and 2%, respectively, in Q2FY26. Engineering & Technology Solutions represented 100% of the line-of-business mix in Q2FY27, and the AI Datacenter segment had not contributed revenue. The shift in end-user mix occurred within an overall revenue increase from Rs 183 crore to Rs 297 crore.
Operating cash flow was Rs 61.0 crore in H1FY27, compared with Rs 45.3 crore in FY26, Rs 5.2 crore in FY25 and negative Rs 65.0 crore in FY24. These are not directly comparable periods because H1FY27 covers six months, whereas the other figures cover full financial years. The presentation does not provide a quarterly operating-cash-flow figure for Q2FY27.
Conclusion
Standard Engineering delivered faster growth in Q2FY27 EBITDA than in revenue, with total expenditure rising 59.0% against revenue growth of 62.3%. However, PAT growth of 37.9% lagged EBITDA growth of 79.7%, and the PAT margin fell to 9.5% as depreciation, interest, tax and a Rs 1.9 crore associate loss were included below EBITDA.
The next disclosed operational milestones are machinery deliveries in mid-November and end-November 2026, SFN plant production beginning on 15 December 2026 and power-side product production beginning on 15 January 2027. The approximately 127,000-square-foot expansion at GScale Energy’s Tukkuguda facility is expected in Q4FY27, while the AI Datacenter segment had yet to contribute revenue in Q2FY27.