










Standard Engineering cuts working-capital cycle to 113 days
Key highlights
- Standard Engineering reported a 113-day working-capital cycle in H1FY27, down 47 days from 160 in FY26.
- Receivable days declined to 86 in H1FY27 from 111 in FY26.
- H1FY27 revenue rose 53.0% year on year to Rs 544.3 crore, while earnings before interest, tax, depreciation and amortisation rose 56.5% to Rs 91 crore.
- Fixed-asset turnover declined to 4.4 times in H1FY27 from 5.2 times in FY26.
powered by IRIS
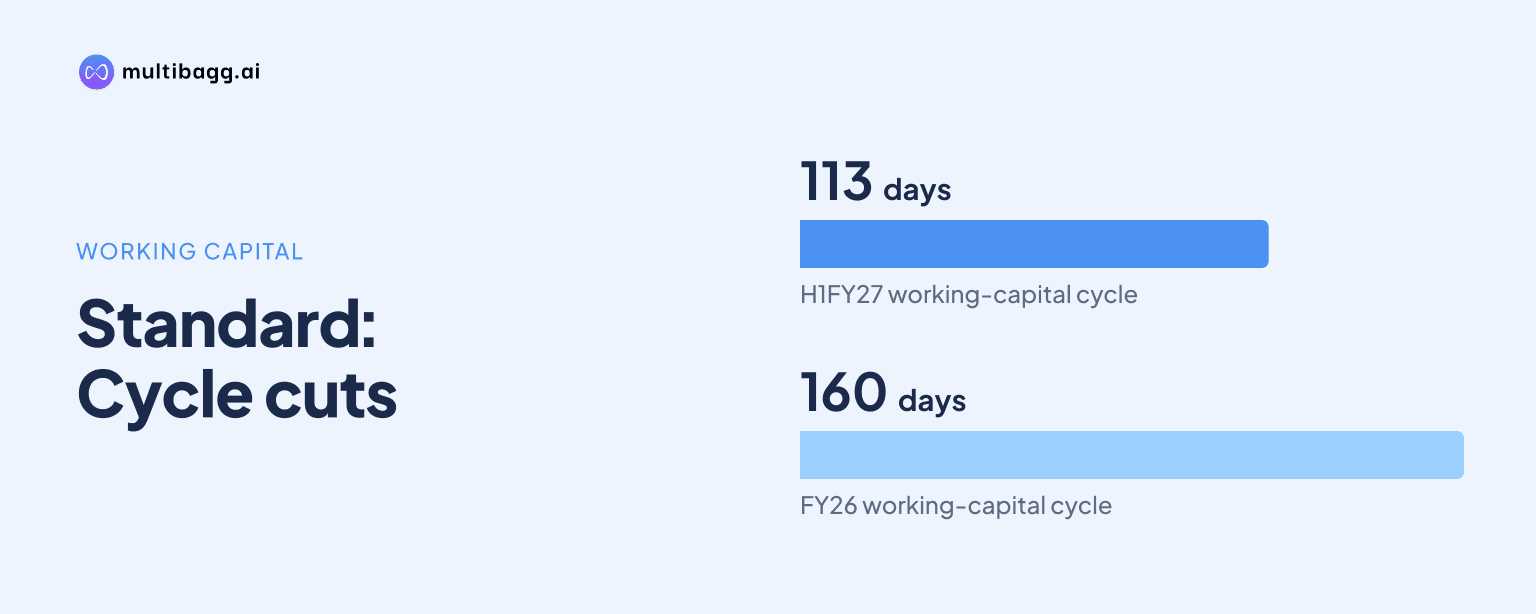
Standard Engineering Technology Limited reported a 113-day working-capital cycle in H1FY27, 47 days below FY26's 160 days, as receivable days declined by 25 to 86, inventory days declined by 10 to 110 and payable days increased by 13 to 84.
Know Standard Engineering Technology inside out
Results, valuation, peers and who's buying, in one view.
How did Standard Engineering cut its working-capital cycle?
Standard Engineering reduced its reported cycle through faster collections, lower inventory days and a longer payable period in H1FY27 versus FY26. Receivable days fell to 86 from 111, inventory days declined to 110 from 120, and payable days increased to 84 from 71. These movements coincided with a reduction in working-capital days to 113 from 160.
Standard Engineering's 47-day reduction was led by the 25-day fall in receivables, while the 13-day increase in payables also lowered the reported cycle. The presentation reports the component ratios and aggregate cycle in days, but does not provide trade-receivable, inventory or trade-payable balances in rupees.
H1FY27 is a half-year period, whereas FY26 covers a full financial year. The comparison therefore shows a lower reported days-based cycle at the H1FY27 reporting point, rather than a full-year cash-flow outcome. The supplied presentation does not disclose an operating-cash-flow figure of Rs 61 crore.
Has Standard Engineering returned to earlier working-capital levels?
Standard Engineering has improved from FY25 and FY26 levels, but its H1FY27 working-capital cycle remains above the 70 days reported in FY23. The cycle was 72 days in FY22 and 70 days in FY23, before rising to 131 days in FY24 and peaking at 174 days in FY25.
The cycle subsequently declined by 14 days to 160 in FY26 and by a further 47 days to 113 in H1FY27. Receivable days had risen from 64 in FY23 to 83 in FY24, 110 in FY25 and 111 in FY26, making the H1FY27 reduction to 86 a reversal of part of that increase.
Inventory days show a similar pattern. Standard Engineering reported 56 inventory days in FY23, 103 in FY24, 123 in FY25 and 120 in FY26, before reporting 110 in H1FY27. Although inventory days declined by 10 from FY26, they remained 54 days above the FY23 level.
Payable days reached 84 in H1FY27, the highest reading among the six displayed periods. The measure was 64 days in FY22, 50 in FY23, 55 in FY24, 59 in FY25 and 71 in FY26. A higher payable-days figure reduces the reported working-capital cycle, but the presentation does not disclose supplier terms or payable balances.
Got a follow-up? Ask IRIS
How did Standard Engineering improve working capital while revenue grew?
Standard Engineering reported H1FY27 revenue of Rs 544.3 crore, up 53.0% from Rs 355.9 crore in H1FY26, while its working-capital cycle declined to 113 days. Earnings before interest, tax, depreciation and amortisation, excluding other income, rose 56.5% to Rs 91 crore from Rs 58.2 crore.
The earnings before interest, tax, depreciation and amortisation margin increased to 16.7% in H1FY27 from 16.3% in H1FY26, a 40-basis-point increase. One basis point is one-hundredth of a percentage point. Standard Engineering achieved the year-on-year revenue and earnings increase while reporting receivable days of 86, compared with 111 in FY26.
H1FY27 revenue was also 70.3% of the Rs 774 crore reported for the full FY26, although the two periods are not directly comparable because H1FY27 covers only six months. Standard Engineering does not attribute the reduction in working-capital days to a named collection programme, customer, product line or supplier initiative.
Net profit increased 32.2% year on year to Rs 54.9 crore in H1FY27 from Rs 41.6 crore, while the net-profit margin declined to 10.0% from 11.3%. Interest expense rose 65.9% to Rs 8.3 crore from Rs 5 crore, and Standard Engineering reported a Rs 1.9 crore share of loss from an associate in H1FY27.
What do Standard Engineering's asset and funding measures show?
Standard Engineering's fixed-asset turnover declined to 4.4 times in H1FY27 from 5.2 times in FY26, which the presentation attributes to new capacity being added ahead of growth. The ratio had fallen from 10.9 times in FY23 to 7.4 times in FY24, 6.0 times in FY25 and 5.2 times in FY26.
Total debt-to-equity increased to 0.22 times in H1FY27 from 0.10 times in FY26, while net debt-to-equity rose to 0.02 times from zero. Standard Engineering describes its balance sheet as net-debt free, and notes that its H1FY27 return on equity and return on capital employed figures are annualised.
Return on equity was 13% in H1FY27, compared with 11% in FY26 and 55% in FY22. Return on capital employed was 19% in H1FY27, against 17% in FY26 and 42% in FY22. Standard Engineering calculates adjusted return ratios using average net worth and capital employed, net of cash; the adjusted H1FY27 figures were 17% for return on equity and 21% for return on capital employed.
Conclusion
Standard Engineering reported a materially shorter working-capital cycle in H1FY27 as receivable and inventory days declined and payable days increased. The 113-day result accompanied 53.0% year-on-year revenue growth to Rs 544.3 crore and 56.5% growth in earnings before interest, tax, depreciation and amortisation to Rs 91 crore, but remains above the 70-day cycle reported in FY23.
The next disclosures will show whether receivable days remain below FY26's 111 days, whether inventory days continue to fall from 110, and whether fixed-asset turnover improves from 4.4 times as capacity is used. Standard Engineering also plans a share swap to increase GScale Energy ownership up to 51%, while GL Hakko's second phase allows investment of up to Rs 117 crore within three years, subject to approval.