










Taurian MPS cash falls to Rs 2.36 crore amid higher inventory
Key highlights
- Taurian MPS reported cash and bank balance of Rs 2.36 crore in H1FY27, compared with Rs 20.37 crore in H1FY26.
- Inventories increased to Rs 51.49 crore in H1FY27 from Rs 28.82 crore a year earlier.
- Short-term borrowings reached Rs 29.13 crore in H1FY27, up from Rs 8.45 crore in H1FY26.
- Total equity rose to Rs 94.63 crore in H1FY27 from Rs 74.42 crore in H1FY26.
powered by IRIS
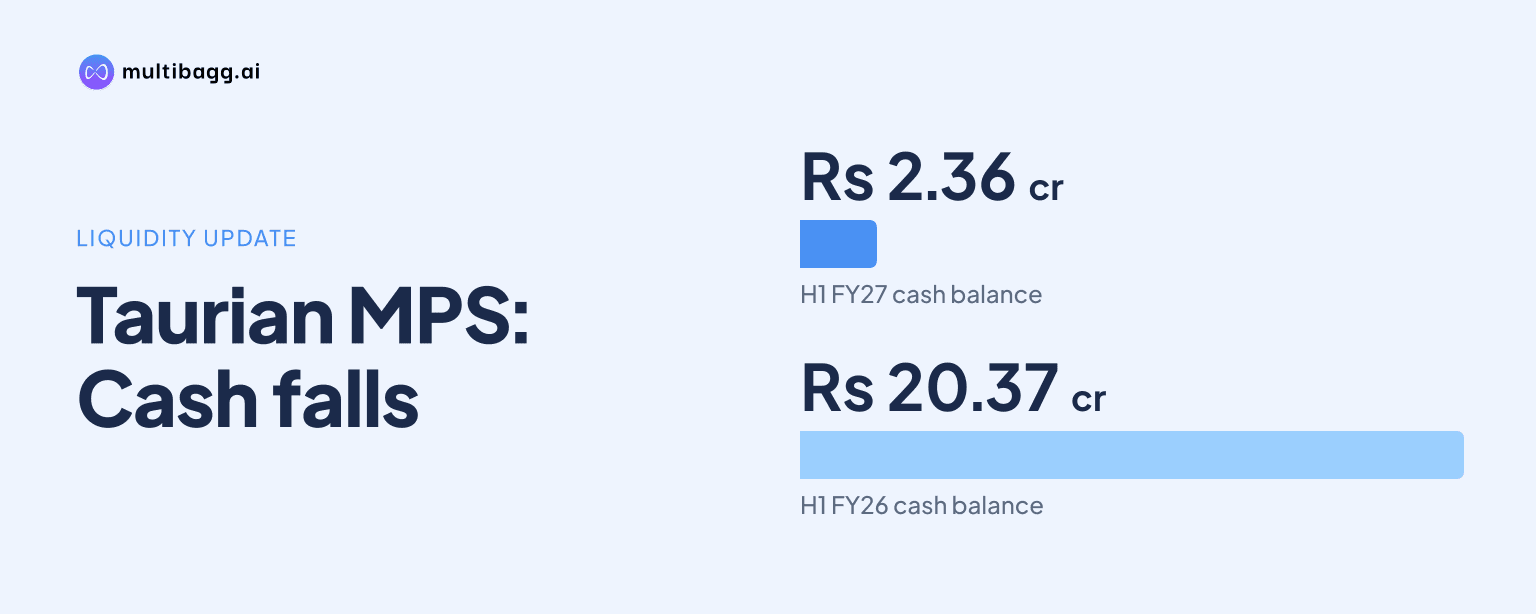
Taurian MPS Limited reported cash and bank balance of Rs 2.36 crore in H1FY27, compared with Rs 20.37 crore in H1FY26, while inventories rose to Rs 51.49 crore and short-term borrowings reached Rs 29.13 crore. Total equity increased to Rs 94.63 crore from Rs 74.42 crore a year earlier.
Know Taurian MPS inside out
Results, valuation, peers and who's buying, in one view.
What changed in Taurian MPS cash and current assets?
Taurian MPS’s cash and bank balance declined by Rs 18.01 crore year on year to Rs 2.36 crore in H1FY27 from Rs 20.37 crore in H1FY26. The H1FY27 cash balance was, however, above the Rs 9.87 lakh reported at FY26. The presentation does not include a cash-flow statement or explain the reasons for the movement in cash.
Inventories increased to Rs 51.49 crore in H1FY27 from Rs 28.82 crore in H1FY26, an increase of Rs 22.67 crore. Inventory was also Rs 4.65 crore above the Rs 46.84 crore reported at FY26. Trade receivables stood at Rs 46.07 crore, up from Rs 27.70 crore a year earlier, but down from Rs 49.46 crore at FY26.
Total current assets were Rs 107.50 crore in H1FY27, compared with Rs 97.20 crore in H1FY26 and Rs 109.87 crore at FY26. Short-term loans and advances were Rs 69.68 lakh in H1FY27, compared with Rs 6.25 lakh in H1FY26, while no amount was shown at FY26. Other current assets fell to Rs 2.67 crore from Rs 20.24 crore a year earlier and Rs 10.46 crore at FY26.
How did Taurian MPS fund its working-capital position?
Taurian MPS reported short-term borrowings of Rs 29.13 crore in H1FY27, up from Rs 8.45 crore in H1FY26 and Rs 22.38 crore at FY26. The latest balance was Rs 20.68 crore higher year on year and Rs 6.75 crore above the FY26 position. The presentation identifies these as short-term borrowings but does not disclose lenders, interest rates, maturities or the use of proceeds.
Total current liabilities rose to Rs 48.70 crore in H1FY27 from Rs 34.53 crore in H1FY26 and Rs 44.57 crore at FY26. Short-term provisions reached Rs 10.58 crore, compared with Rs 32.85 lakh in H1FY26 and Rs 7.95 crore at FY26. Trade payables were Rs 9 crore, higher than Rs 5.26 crore a year earlier but below Rs 14.25 crore at FY26.
The current-liability mix differs across the periods because other current liabilities of Rs 20.49 crore were reported in H1FY26, whereas no amount was shown for this line in H1FY27 or FY26. This presentation difference means the year-on-year movement in the reported categories includes both higher short-term borrowings and provisions, alongside the absence of a separately disclosed other-current-liabilities balance in H1FY27.
Got a follow-up? Ask IRIS
How did Taurian MPS equity and longer-term liabilities change?
Taurian MPS reported total equity of Rs 94.63 crore in H1FY27, compared with Rs 74.42 crore in H1FY26. Equity share capital remained unchanged at Rs 8.88 crore, while reserves and surplus rose to Rs 85.75 crore from Rs 65.54 crore. Reserves and surplus were also above the Rs 78.10 crore reported at FY26.
Non-current liabilities were Rs 2.73 crore in H1FY27, compared with Rs 1.23 crore in H1FY26 and Rs 2.72 crore at FY26. Long-term borrowings were Rs 1.85 crore, versus Rs 80.62 lakh a year earlier and Rs 2.17 crore at FY26. Long-term provisions were Rs 35.58 lakh and deferred tax liabilities were Rs 52.91 lakh in H1FY27.
Total equity and liabilities reached Rs 148.67 crore in H1FY27, up from Rs 110.18 crore in H1FY26 and Rs 134.28 crore at FY26. The reported H1FY27 increase from FY26 reflected higher reserves and surplus, current liabilities and total non-current liabilities. The FY26 total-equity line is blank in the presentation, although it separately reports Rs 8.88 crore of equity share capital and Rs 78.10 crore of reserves and surplus.
What do Taurian MPS asset movements show alongside profit growth?
Taurian MPS reported total assets of Rs 148.67 crore in H1FY27, compared with Rs 110.18 crore in H1FY26 and Rs 134.28 crore at FY26. Fixed assets increased to Rs 26.43 crore from Rs 12.24 crore a year earlier and Rs 20.58 crore at FY26. Intangible assets were Rs 25.66 lakh, below Rs 37.29 lakh in H1FY26 and Rs 31.48 lakh at FY26.
Total non-current assets were reported at Rs 41.17 crore in H1FY27, compared with Rs 12.98 crore in H1FY26 and Rs 24.41 crore at FY26. The reported H1FY27 total is higher than the separately listed Rs 26.43 crore of fixed assets and Rs 25.66 lakh of intangible assets. Other non-current assets have no amount shown, and the presentation does not provide a breakdown of the difference.
The balance-sheet movements occurred alongside H1FY27 revenue of Rs 56.01 crore, up from Rs 32.29 crore in H1FY26. Profit after tax rose to Rs 7.65 crore from Rs 3.67 crore, while earnings before interest, tax, depreciation and amortisation, or EBITDA, increased to Rs 12.34 crore from Rs 6.76 crore. Finance costs rose to Rs 1.10 crore from Rs 65.34 lakh during the same period.
Conclusion
Taurian MPS’s H1FY27 balance sheet shows a larger asset base and higher equity alongside a material shift in working-capital balances. Cash and bank balance was Rs 2.36 crore, inventories were Rs 51.49 crore, trade receivables were Rs 46.07 crore and short-term borrowings were Rs 29.13 crore, compared with cash of Rs 20.37 crore and borrowings of Rs 8.45 crore in H1FY26.
The next reported period will show whether inventory, receivables, cash and short-term borrowings move from their H1FY27 levels as revenue develops beyond the Rs 56.01 crore reported for the first half. The presentation does not disclose a borrowing target, cash target or working-capital plan, and it does not explain the reported classification differences between H1FY26 and H1FY27 current liabilities.