










TCC H1 FY27 revenue was Rs 261.9 crore; cash use Rs 74.1 crore
Key highlights
- TCC reported Rs 261.9 crore of revenue from operations and Rs 37.4 crore of PAT in H1 FY27.
- TCC reported negative Rs 74.1 crore of cash flow from operations in H1 FY27.
- TCC closed H1 FY27 with Rs 21.2 crore of cash and cash equivalents and Rs 73.1 crore of trade receivables.
- TCC's FY26 revenue from operations increased by Rs 96.2 crore to Rs 179.4 crore.
powered by IRIS
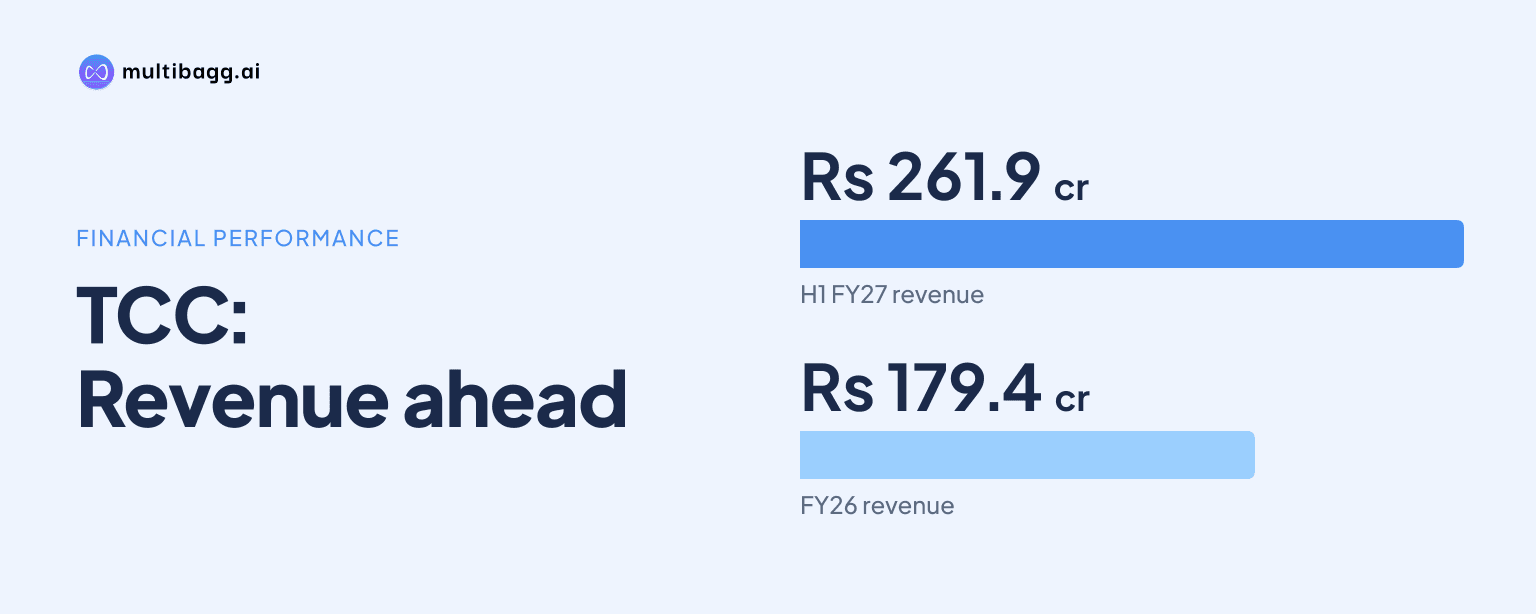
TCC Concept Limited (TCC) reported Rs 261.9 crore of revenue from operations and Rs 37.4 crore of profit after tax in H1 FY27, while cash flow from operations was negative Rs 74.1 crore. The half-year presentation therefore shows reported profit alongside an operating cash outflow, despite closing cash and cash equivalents of Rs 21.2 crore.
Know TCC Concept inside out
Results, valuation, peers and who's buying, in one view.
What did TCC report in H1 FY27?
TCC reported total income of Rs 267.8 crore in H1 FY27, comprising Rs 261.9 crore of revenue from operations and Rs 5.9 crore of other income. Total expense was Rs 236.8 crore, resulting in profit before tax, or PBT, of Rs 31 crore and profit after tax, or PAT, of Rs 37.4 crore. Earnings per share were 1.51 for the half year.
TCC reported a 12% PBT margin and a 14% PAT margin for H1 FY27. The presentation records no exceptional items for the period, but it does not provide a tax reconciliation or another explanation for PAT exceeding PBT by Rs 6.4 crore. That omission limits analysis of the items between pre-tax and post-tax profit.
How did TCC's Q2 FY27 results compare with H1 FY27?
TCC's Q2 FY27 revenue from operations was Rs 133.7 crore, representing slightly more than half of its Rs 261.9 crore H1 FY27 revenue. Q2 total income was Rs 136.5 crore and PAT was Rs 24.8 crore, compared with Rs 267.8 crore and Rs 37.4 crore, respectively, for the full half year.
TCC's Q2 FY27 PBT margin of 14% was 2 percentage points above the H1 FY27 margin of 12%, while its Q2 PAT margin of 19% was 5 percentage points above the half-year figure of 14%. Q2 PAT accounted for about two-thirds of the H1 PAT, based on the disclosed Rs 24.8 crore and Rs 37.4 crore figures. The presentation does not provide H1 FY26 figures, so it does not support a year-on-year comparison for H1 FY27.
How did TCC's annual financial results change through FY26?
TCC's revenue from operations rose by Rs 96.2 crore to Rs 179.4 crore in FY26 from Rs 83.2 crore in FY25. Total income increased by Rs 116.8 crore to Rs 206.3 crore, including Rs 26.9 crore of other income, compared with Rs 6.3 crore in FY25. FY26 is a full-year period and is therefore not directly comparable with H1 FY27.
TCC's FY26 PAT increased to Rs 64.8 crore from Rs 42.1 crore in FY25, while PAT margin declined to 36% from 51%. Total expense increased by Rs 117.2 crore to Rs 151.8 crore, and PBT declined marginally to Rs 54.4 crore from Rs 54.9 crore. The annual figures show that revenue and PAT increased, but the expense base grew faster than revenue between FY25 and FY26.
Got a follow-up? Ask IRIS
What did TCC's H1 FY27 balance sheet show?
TCC reported equity of Rs 1,708.6 crore at H1 FY27, up Rs 63.3 crore from Rs 1,645.3 crore at FY26. Total current assets were Rs 237.9 crore and total current liabilities were Rs 192.7 crore, leaving a difference of Rs 45.2 crore between the two reported current-balance categories.
TCC listed trade receivables of Rs 73.1 crore, cash and cash equivalents of Rs 21.2 crore, and bank balances other than cash equivalents of Rs 1.7 crore at H1 FY27. Compared with FY26, current assets increased by Rs 24.2 crore from Rs 213.7 crore, while current liabilities declined by Rs 1.1 crore from Rs 193.8 crore. The presentation does not provide H1 FY27 totals for non-current assets or non-current liabilities.
Why did TCC report operating cash outflow despite profit?
TCC reported negative cash flow from operations of Rs 74.1 crore in H1 FY27 despite PAT of Rs 37.4 crore. The presentation gives only the cash-flow category totals and does not provide a working-capital bridge, receivables movement, collection data or indirect cash-flow reconciliation. Trade receivables were Rs 73.1 crore at the half year, but the presentation does not attribute the operating outflow to receivables or any other item.
TCC reported Rs 18.8 crore of cash flow from investing activities, negative Rs 35.8 crore from financing activities and positive net cash flow of Rs 5.6 crore in H1 FY27. Closing cash and cash equivalents of Rs 21.2 crore were Rs 5.6 crore above the Rs 15.6 crore opening cash balance. However, the three displayed operating, investing and financing cash-flow categories add to negative Rs 91.1 crore, rather than the stated positive Rs 5.6 crore net cash flow, and the presentation provides no note reconciling the difference.
Conclusion
TCC's H1 FY27 figures show a clear difference between reported earnings and operating cash generation: revenue from operations was Rs 261.9 crore and PAT was Rs 37.4 crore, while operating cash flow was negative Rs 74.1 crore. The balance-sheet snapshot also shows Rs 73.1 crore of trade receivables and Rs 21.2 crore of cash and cash equivalents, but it does not explain the cash-flow movement.
The next disclosed item to watch is TCC's plan for TryThat.ai, which lists scaling business-to-business adoption, expanding product capabilities and deepening monetisation as near-term priorities. Its project subscriptions are priced at Rs 50,000 to Rs 2 lakh per project, with usage-based WhatsApp and artificial-intelligence calling add-ons also identified as revenue streams; future disclosures may show whether these plans translate into collections and operating cash flow.