










Torrent Power cuts Bhiwandi AT&C losses to 9.1% in FY26
Key highlights
- Torrent reduced Bhiwandi AT&C losses from 58% at takeover to about 9.1% in FY26.
- Agra reported the lowest disclosed FY26 franchisee AT&C loss at about 5.4%.
- Surat reported a 2.77% FY26 distribution loss and 99.9% power availability.
- Dadra and Nagar Haveli and Daman and Diu reported FY26 distribution losses below 2% and peak demand of 1,437 MW.
powered by IRIS
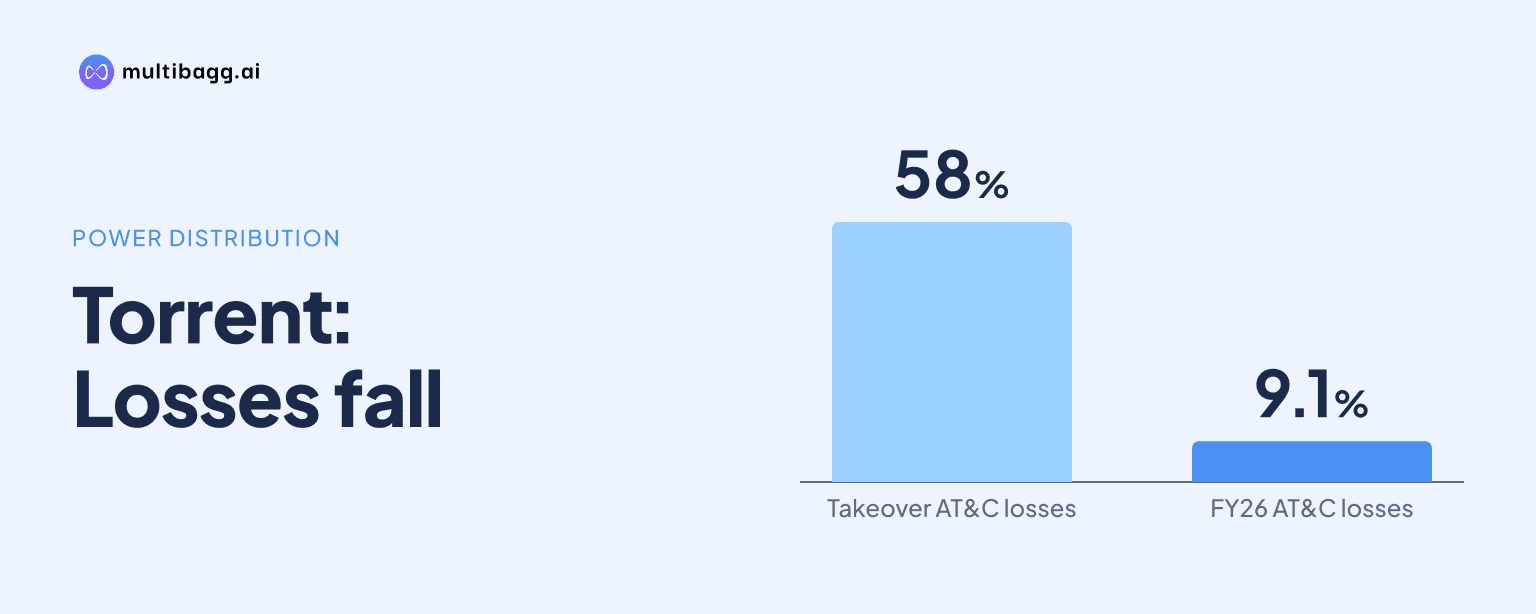
Torrent Power reported Bhiwandi aggregate technical and commercial (AT&C) losses of about 9.1% in FY26, down from 58% at takeover, an approximately 48.9-percentage-point reduction in a franchise covering about 721 square kilometres with FY26 peak demand of 634 megavolt-amperes (MVA) under a first-of-its-kind distribution franchisee agreement.
Know Torrent Power inside out
Results, valuation, peers and who's buying, in one view.
How much did Torrent reduce Bhiwandi AT&C losses?
Torrent reduced Bhiwandi’s AT&C losses from 58% at takeover to about 9.1% in FY26. The disclosed change is approximately 48.9 percentage points, although the presentation does not specify the takeover date or provide annual loss figures between takeover and FY26.
Bhiwandi covered about 721 square kilometres and recorded peak demand of 634 MVA in FY26. The presentation identifies its arrangement with MSEDCL as the country’s first-of-its-kind distribution franchisee agreement, but does not disclose the operational actions behind the reported loss reduction.
The FY26 figure places Bhiwandi below a 10% AT&C-loss level after beginning at 58%. Since the presentation reports AT&C losses for franchisee areas but distribution losses for licensed areas, the 9.1% figure should be compared directly with Agra and Shil, Mumbra, Kalwa rather than with licensed-network loss percentages.
How does Bhiwandi compare with Torrent’s other franchisees?
Torrent’s Agra franchise reported the lowest FY26 AT&C loss among its three disclosed franchisee areas, at about 5.4%, compared with about 9.1% in Bhiwandi and about 23.1% in Shil, Mumbra, Kalwa. Agra’s reported loss fell from 58.77% at takeover, while Shil, Mumbra, Kalwa started at a reported 48%.
Agra’s approximately 53.37-percentage-point movement was larger than Bhiwandi’s approximately 48.9-point movement based on the disclosed endpoints. Agra covered about 221 square kilometres and had FY26 peak demand of 588 MVA, compared with Bhiwandi’s 721 square kilometres and 634 MVA.
Shil, Mumbra, Kalwa had the highest FY26 AT&C loss of the three franchisee areas at about 23.1%. Its area was about 65 square kilometres and its FY26 peak demand was 165 MVA, while the presentation does not identify the reasons its FY26 loss level remained above Bhiwandi’s and Agra’s levels.
Got a follow-up? Ask IRIS
What distribution losses did Torrent’s licensed networks report?
Torrent reported FY26 distribution losses of 3.35% in Ahmedabad and Gandhinagar, 2.77% in Surat, and below 2% in Dadra and Nagar Haveli and Daman and Diu. These are distribution-loss measures rather than the AT&C-loss measures disclosed for the three franchisee networks.
Ahmedabad and Gandhinagar served more than 21 lakh customers across about 356 square kilometres and reported FY26 peak demand of 1,967 megawatts (MW). Surat served more than 6 lakh customers over about 52 square kilometres and had peak demand of 764 MW, with its 2.77% loss level 0.58 percentage points below Ahmedabad and Gandhinagar’s 3.35%.
Dadra and Nagar Haveli and Daman and Diu covered about 603 square kilometres, served more than 1.7 lakh customers and recorded FY26 peak demand of 1,437 MW. Its loss disclosure of below 2% was lower than Surat’s 2.77% and Ahmedabad and Gandhinagar’s 3.35%, but the presentation does not provide a precise percentage.
How available are Torrent’s licensed distribution networks?
Torrent disclosed 99.9% power availability for Ahmedabad and Gandhinagar and for Surat, while Dahej reported 99.9% power reliability. The presentation uses availability for the first two areas and reliability for Dahej, so it does not establish that the measures are directly equivalent.
Dahej covered about 17 square kilometres, had 146 customers and recorded FY26 peak demand of 117 MW. Torrent describes itself as the second licensee at Dahej Special Economic Zone, but does not disclose a distribution-loss percentage for the area.
Torrent also identifies Dholera Special Investment Region as a second-licensee area spanning about 920 square kilometres, with FY26 peak demand of 18 MW. The presentation states that Dholera is part of the Delhi-Mumbai Industrial Corridor being developed as an industrial hub, but gives no customer count, loss figure or availability measure for the area.
Across the disclosed licensed markets, Ahmedabad and Gandhinagar had the highest peak demand at 1,967 MW, followed by Dadra and Nagar Haveli and Daman and Diu at 1,437 MW and Surat at 764 MW. Bhiwandi’s 634 MVA franchisee peak demand is reported in MVA rather than MW, and the presentation provides no conversion between those units.
Conclusion
Torrent’s FY26 disclosures show reported AT&C-loss reductions across all three franchisee areas, led by Agra’s decline from 58.77% to about 5.4% and Bhiwandi’s decline from 58% to about 9.1%. The licensed portfolio reported distribution losses from below 2% to 3.35%, while Ahmedabad and Gandhinagar and Surat each reported 99.9% power availability.
The next reported milestone to watch is the post-FY26 AT&C-loss level in Bhiwandi, Agra and Shil, Mumbra, Kalwa, particularly as the latter remained at about 23.1% in FY26. Torrent’s presentation also leaves unresolved whether it will disclose exact loss data for Dadra and Nagar Haveli and Daman and Diu, and comparable loss and availability data for the 18 MW Dholera area.