










Torrent Power EBITDA rose 11% CAGR as FY26 returns fell
Key highlights
- Torrent Power reported EBITDA of Rs 5,864 crore in FY26, compared with Rs 3,826 crore in FY22.
- Return on capital employed declined to 10.3% in FY26 from 12.7% in FY25.
- Net debt to EBITDA increased to 2.06 times in FY26 from 1.41 times in FY25.
- Net worth rose to Rs 20,704 crore in FY26 from Rs 10,289 crore in FY22.
powered by IRIS
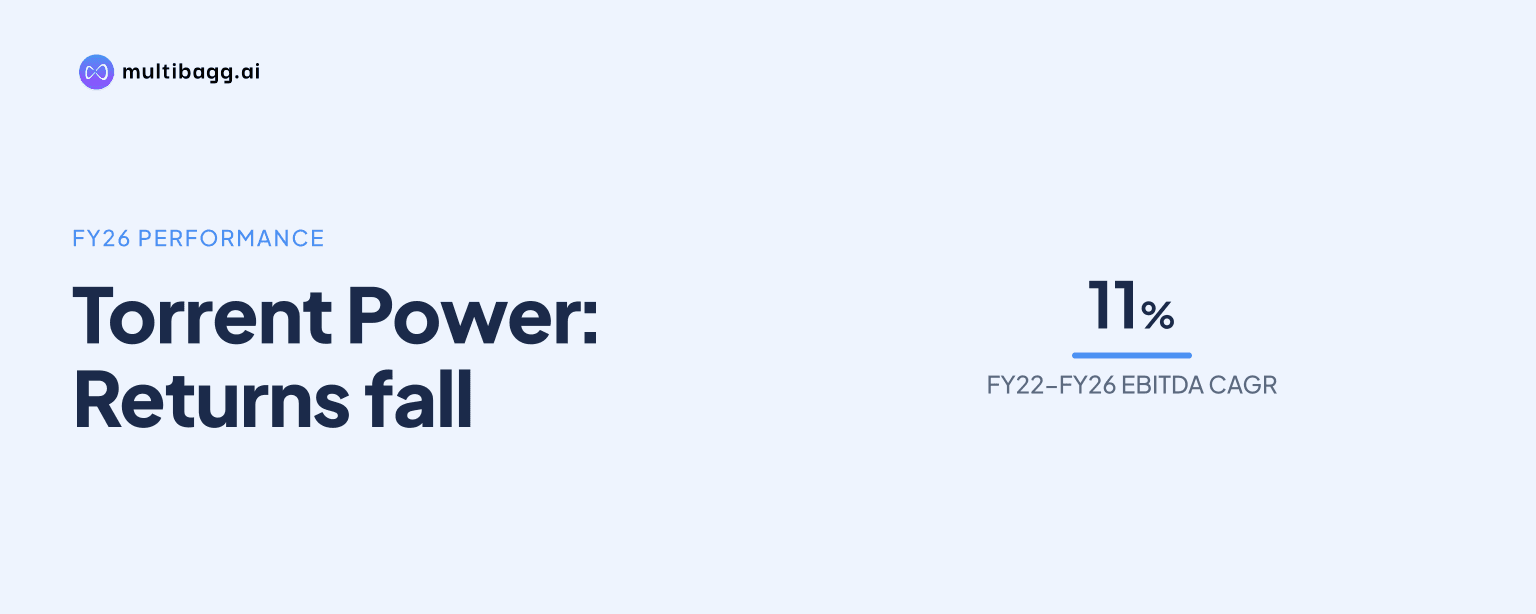
Torrent Power Limited reported EBITDA of Rs 5,864 crore in FY26, completing an 11% five-year compound annual growth rate, but its return on capital employed declined to 10.3% and net debt to EBITDA rose to 2.06 times from 1.41 times in FY25. The figures show growth in operating earnings and net worth alongside lower FY26 returns and higher leverage ratios.
Know Torrent Power inside out
Results, valuation, peers and who's buying, in one view.
How did Torrent Power's revenue, EBITDA and net worth change over five years?
Torrent Power increased EBITDA from Rs 3,826 crore in FY22 to Rs 5,864 crore in FY26, an 11% compound annual growth rate, while net worth rose from Rs 10,289 crore to Rs 20,704 crore. EBITDA, or earnings before interest, depreciation, tax and amortisation, increased by Rs 2,038 crore across the period. Net worth, which the presentation says includes deferred tax liabilities, increased by Rs 10,415 crore.
Revenue from operations climbed from Rs 14,257 crore in FY22 to Rs 28,966 crore in FY26, although FY26 revenue was Rs 199 crore below the Rs 29,165 crore reported in FY25. EBITDA nevertheless rose Rs 69 crore year on year from Rs 5,795 crore in FY25. This means the final-year movement differed between the two measures: operating revenue declined modestly, while EBITDA edged higher.
Torrent Power reported TCI of Rs 2,416 crore in FY26, down Rs 573 crore from Rs 2,989 crore in FY25. The presentation gives a 15% adjusted compound annual growth rate for TCI, rather than an unadjusted rate, because FY22 TCI included an impairment provision of Rs 928 crore, net of deferred-tax reversal. The source does not expand the term TCI, so its reported label is retained here.
Why did Torrent Power's FY26 return and leverage measures move differently?
The presentation does not identify the causes of the FY26 changes in Torrent Power's returns and leverage measures. Return on capital employed, or ROCE, fell to 10.3% in FY26 from 12.7% in FY25, while return on net worth declined to 12.2% from 18.4%. The ROCE reduction was 2.4 percentage points and the return-on-net-worth reduction was 6.2 percentage points.
Net debt to EBITDA increased to 2.06 times in FY26 from 1.41 times in FY25, reversing the prior-year decline. Net debt to equity also rose to 0.56 times from 0.40 times. These two FY26 ratio changes occurred even as EBITDA rose from Rs 5,795 crore to Rs 5,864 crore and net worth grew from Rs 18,968 crore to Rs 20,704 crore, so the presentation records a mixed financial trajectory rather than a uniform movement across metrics.
FY26 ROCE returned exactly to its FY22 level of 10.3%, after reaching 14.0% in FY23 and 12.7% in FY25. Return on net worth showed a different five-year endpoint: its 12.2% FY26 result was 2.0 percentage points below the 14.2% recorded in FY22. The ratios do not identify the individual drivers of these changes, so the presentation supports the direction and scale of the movements but not a causal explanation.
Got a follow-up? Ask IRIS
What did Torrent Power's operating statistics show in FY26?
Torrent Power's aggregate thermal plant load factor, or PLF, declined to 25% in FY26 from 31% in FY25, while solar PLF increased to 24% from 16%. PLF measures the utilisation of generating capacity over a period. The thermal result was also below the 33% recorded in FY24, whereas the solar result was the highest of the five annual figures shown.
The individual thermal stations did not move in the same direction. AMGEN operated at 78% PLF in FY26, down from 81% in FY25, while SUGEN declined to 27% from 34%. UNOSUGEN fell to 11% from 20%, and DGEN decreased to 11% from 15%. Those changes coincided with the aggregate thermal PLF decrease of 6 percentage points in FY26.
Wind PLF moved in the opposite direction to solar, declining to 20% in FY26 from 24% in FY25 and from 27% in FY24. In distribution, licensed-area transmission and distribution loss was 3.4% in Ahmedabad in FY26 versus 3.3% in FY25, while Surat was unchanged at 2.8% and Dahej was unchanged at 0.5%. The five-year tables exclude the Daman and Diu and Dadra Nagar Haveli distribution-area takeover from 1 April 2022.
How did distribution losses develop across Torrent Power's franchised areas?
Torrent Power reduced transmission and distribution losses in each of its three listed franchised distribution areas between FY22 and FY26. Bhiwandi fell to 9.1% from 11.6%, Agra to 8.4% from 12.1%, and SMK to 23.7% from 40.5%. SMK recorded the largest absolute reduction, down 16.8 percentage points over the five-year period.
The FY26 result was also an improvement on FY25 for all three franchised areas. Bhiwandi declined by 0.9 percentage points from 10.0%, Agra by 0.2 percentage points from 8.6%, and SMK by 4.3 percentage points from 28.0%. These loss movements provide an operational comparison alongside the financial data, but the presentation does not quantify their direct contribution to FY26 EBITDA of Rs 5,864 crore.
The licensed distribution data were comparatively stable over the five years. Ahmedabad's loss level was 3.4% in FY26 versus 4.2% in FY22, Surat was 2.8% versus 3.4%, and Dahej was unchanged at 0.5%. This contrasts with the sharper reductions shown in SMK, whose FY26 loss remained above the 9.1% in Bhiwandi and 8.4% in Agra.
Conclusion
Torrent Power combined a five-year rise in EBITDA from Rs 3,826 crore to Rs 5,864 crore with a doubling of net worth to Rs 20,704 crore. However, FY26 did not extend the prior year's improvement in every financial measure: revenue and TCI declined from FY25, returns fell, and both net-debt ratios increased.
The next developments to watch are management's stated plans to scale installed renewable energy capacity and its eventual target of about 8.4 gigawatts of capacity in green hydrogen and pumped storage power. The presentation does not disclose the timing, capital requirement or financial effect of those plans, while FY26 net debt to EBITDA stood at 2.06 times.