










Total Transport FCL Volume Rose to 20,000 TEUs During FY26
Key highlights
- Total Transport's FCL forwarding volume increased from 8,000 TEUs in FY22 to 20,000 TEUs in FY26.
- FCL export volume rose from 6,000 TEUs in FY22 to 18,000 TEUs in FY26, while imports ended at 2,000 TEUs.
- Total LCL consolidation was 411,000 CBMs in FY26, compared with 403,000 CBMs in FY22 and 423,000 CBMs in FY25.
- Total Transport reported FY26 revenue of Rs 622 crore, EBITDA of Rs 15 crore and profit after tax of Rs 8 crore.
powered by IRIS
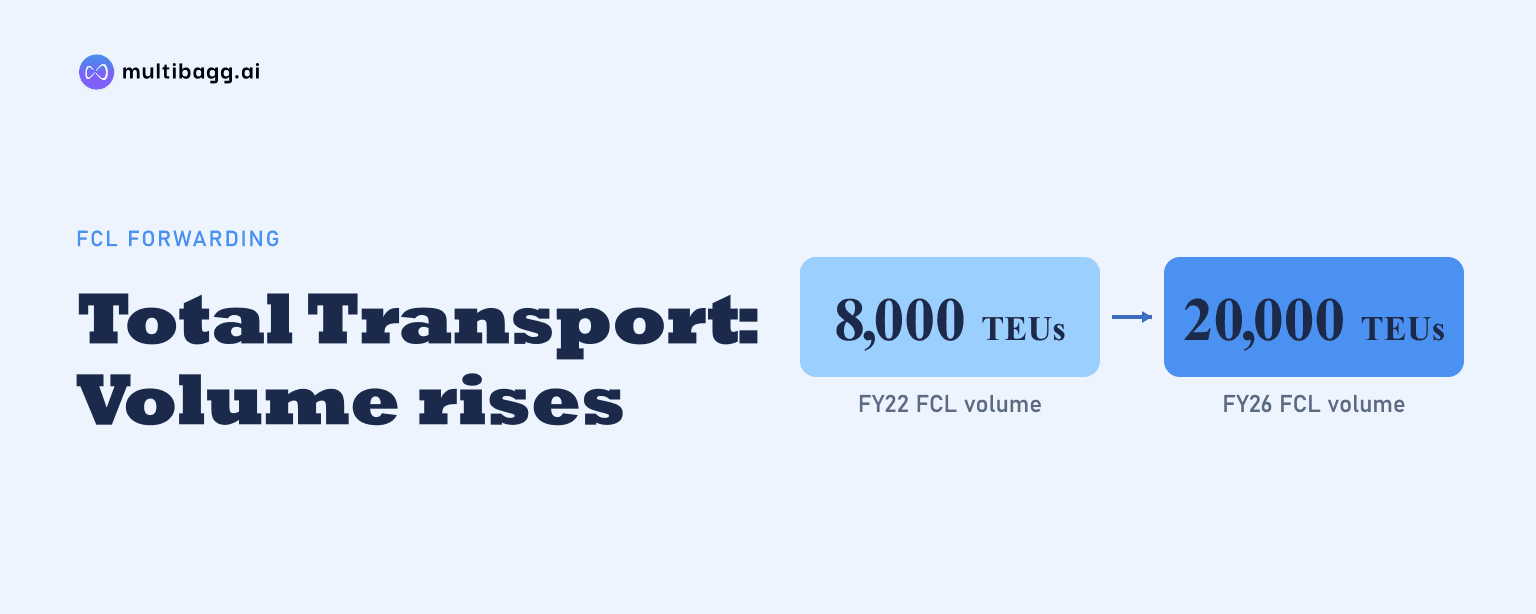
Total Transport Systems Limited reported 20,000 twenty-foot equivalent units (TEUs) of full-container-load (FCL) forwarding in FY26, up from 8,000 TEUs in FY22, while less-than-container-load (LCL) consolidation was 411,000 cubic metres (CBMs), against 403,000 CBMs. The historical data show substantially faster growth in FCL volumes than in LCL throughput.
Know Total Transport Systems inside out
Results, valuation, peers and who's buying, in one view.
What changed in Total Transport's freight volumes?
Total Transport's reported FCL forwarding volume increased in each financial year, rising from 8,000 TEUs in FY22 to 10,000 in FY23, 15,000 in FY24, 17,000 in FY25 and 20,000 in FY26. This 12,000-TEU increase contrasts with total LCL consolidation, which increased by 8,000 CBMs from 403,000 CBMs in FY22 to 411,000 CBMs in FY26.
Total Transport's LCL volume varied within a relatively narrow range across the five reported years. Total LCL reached 410,000 CBMs in FY23, eased to 406,000 CBMs in FY24, peaked at 423,000 CBMs in FY25 and fell to 411,000 CBMs in FY26, leaving FY26 12,000 CBMs below the FY25 peak.
How did Total Transport's FCL exports and imports differ?
Total Transport's FCL growth over FY22 to FY26 was driven by exports, which increased from 6,000 TEUs to 18,000 TEUs, while imports began and ended the period at 2,000 TEUs. Import FCL volumes reached 3,000 TEUs in FY24 and FY25 before returning to 2,000 TEUs in FY26.
Exports accounted for 18,000 of Total Transport's reported 20,000 FCL TEUs in FY26, compared with 6,000 of 8,000 TEUs in FY22. The presentation does not disclose customer categories, trade lanes, freight rates, capacity additions or commercial actions that explain the export-led increase.
The annual export series rose from 6,000 TEUs in FY22 to 8,000 in FY23, 12,000 in FY24, 15,000 in FY25 and 18,000 in FY26. In contrast, the import series remained between 2,000 and 3,000 TEUs in every year shown, indicating that the reported change in FCL activity was concentrated in exports rather than imports.
Why did Total Transport's LCL volumes remain broadly flat?
Total Transport's LCL total remained broadly flat over the period because rising import consolidation volumes were partly offset by lower export volumes. LCL imports increased from 146,000 CBMs in FY22 to 175,000 CBMs in FY26, whereas LCL exports declined from 257,000 CBMs to 236,000 CBMs.
LCL imports recorded their highest reported level of 175,000 CBMs in FY26, after 157,000 CBMs in FY25. LCL exports, however, declined by 30,000 CBMs from their FY25 high of 266,000 CBMs to 236,000 CBMs in FY26, while imports increased by 18,000 CBMs over the same year.
The presentation measures LCL in CBMs and FCL in TEUs, so the services cannot be added into one physical-volume measure. It also provides no segment revenue, margin or profit data for the FY26 FCL total of 20,000 TEUs or the LCL total of 411,000 CBMs.
Got a follow-up? Ask IRIS
How do Total Transport's volume trends compare with financial results?
Total Transport reported revenue of Rs 622 crore in FY26, compared with Rs 583 crore in FY22 and Rs 665 crore in FY25. FCL volume reached its five-year high of 20,000 TEUs in FY26 even as consolidated revenue declined by Rs 43 crore from the prior year's reported Rs 665 crore.
Earnings before interest, tax, depreciation and amortisation (EBITDA) were Rs 15 crore in FY26, compared with Rs 16 crore in FY22 and Rs 13 crore in FY25. The EBITDA margin was 2.4% in FY26, versus 2.8% in FY22 and 2.0% in FY25; the presentation does not attribute those movements to FCL, LCL or air freight.
Profit after tax was Rs 8 crore in FY26, following Rs 9 crore in FY25 and Rs 1 crore in FY24. Earnings before interest and tax were Rs 15 crore in FY26, with a 2.4% margin, but Total Transport provides no breakdown linking the increase from 17,000 FCL TEUs in FY25 to 20,000 TEUs in FY26 with the Rs 1 crore decline in profit after tax.
What does Total Transport disclose about future volume plans?
Total Transport's September 2026 investor presentation provides FY22-to-FY26 historical volume data but does not disclose an FY27 FCL, LCL or air-freight target. It records 20,000 FCL TEUs, 411,000 LCL CBMs and 1,436 tons of air freight in FY26 without setting a future operating-volume objective.
Air freight is another reported operating measure: total volume increased from 1,318 tons in FY22 to 1,436 tons in FY26, after 1,371 tons in FY25. FY26 import tonnage was 255 tons, up from 184 tons in FY25, while export tonnage was 1,181 tons compared with 1,187 tons.
The presentation also records Total Transport's participation in the India International Cargo Show 2025 in Mumbai, including engagement with trade bodies, logistics partners and industry stakeholders. It does not disclose a trade-corridor expansion plan, capital-expenditure programme, scheduled financial-result date or management target associated with that event.
Conclusion
Total Transport's FY22-to-FY26 data indicate that operating activity shifted toward export-oriented FCL forwarding. Total FCL volume increased by 12,000 TEUs, with exports rising by 12,000 TEUs, while LCL consolidation increased by 8,000 CBMs and revenue moved from Rs 583 crore in FY22 to Rs 622 crore in FY26.
The next issue to watch is whether Total Transport provides FY27 volume targets or segment-level financial disclosure, neither of which appears in the September 2026 presentation. Future data would clarify whether FCL exports extend beyond 18,000 TEUs, whether LCL exports recover from 236,000 CBMs, and how volumes relate to consolidated revenue, EBITDA and profit after tax.