










Triveni: Global steam-turbine market nearly doubled by 2025
Key highlights
- The global steam-turbine market increased from 60 GW in 2021 to 116 GW in 2025.
- The sub-100 MW market excluding China and Japan was 7.0 GW in both 2021 and 2025.
- The above-100 MW market excluding China and Japan rose from 20.5 GW to 53.0 GW between 2021 and 2025.
- Thermal renewables accounted for 65% of the sub-100 MW market in 2025, versus 66% in 2021.
powered by IRIS
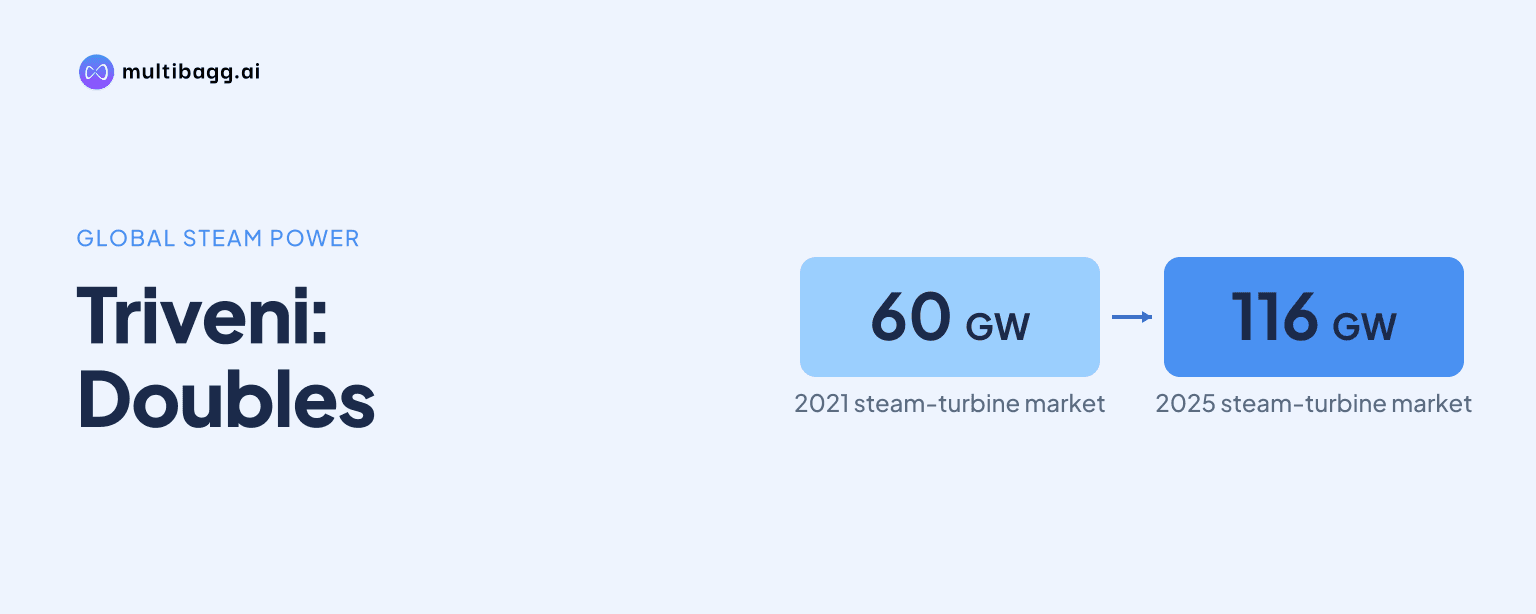
Triveni Turbines presented a global steam-turbine market of 116 GW in 2025, up from 60 GW in 2021, while the market below 100 MW excluding China and Japan remained at 7.0 GW in both years. The data show that the four-year expansion was concentrated in turbines rated above 100 MW.
Know Triveni Turbine inside out
Results, valuation, peers and who's buying, in one view.
How fast did global steam-turbine demand grow?
Global steam-turbine demand grew by 56 GW, or about 93%, from 60 GW in 2021 to 116 GW in 2025. Triveni, citing the McCoy Report 2025, describes the 2021-2025 increase as a compound annual growth rate, or CAGR, of 17.7%.
The annual series rose from 60 GW in 2021 to 82 GW in 2022, 96 GW in 2023 and 118 GW in 2024, before declining by 2 GW to 116 GW in 2025. The 2025 market was therefore nearly double its 2021 level, although it was below the 118 GW peak recorded in 2024. Triveni provides market data only through 2025 and does not disclose a market forecast for 2026 or later.
What happened to the sub-100 MW market outside China and Japan?
The steam-turbine market below 100 MW excluding China and Japan was unchanged over the full period at 7.0 GW in both 2021 and 2025. It declined to 6.1 GW in 2022, recovered to 6.5 GW in 2023, fell to 5.6 GW in 2024 and returned to 7.0 GW in 2025.
The market above 100 MW drove the regional increase, rising by 32.5 GW from 20.5 GW in 2021 to 53.0 GW in 2025. Triveni reports a 26.8% CAGR for this category between 2021 and 2025. Above-100 MW turbines accounted for 53.0 GW of the 60.0 GW regional market in 2025, compared with 20.5 GW of 27.5 GW in 2021.
Which sub-100 MW turbine ratings changed between 2021 and 2025?
In 2025, the 30.1-100 MW band represented 3.8 GW of the 7.0 GW sub-100 MW market outside China and Japan, while the below-30 MW band represented 3.2 GW. The 30.1-100 MW band was 0.2 GW below its 4.0 GW level in 2021, whereas the below-30 MW band was 0.3 GW above its 2.9 GW level in 2021.
The below-30 MW category rose from 2.9 GW in 2021 to 3.2 GW in 2023, stood at 3.1 GW in 2024 and reached 3.2 GW in 2025. The 30.1-100 MW category fell from 4.0 GW in 2021 to 3.0 GW in 2022, reached 3.3 GW in 2023, dropped to 2.5 GW in 2024 and recovered to 3.8 GW in 2025.
Triveni's size-band table contains a 2024 total of 6.1 GW for the sub-100 MW market, while its two components, 3.1 GW below 30 MW and 2.5 GW at 30.1-100 MW, total 5.6 GW. The separate market-size table also gives 5.6 GW for the 2024 sub-100 MW market, so the presentation does not reconcile the 6.1 GW total in the size-band table.
Got a follow-up? Ask IRIS
How large was thermal renewables' share of the smaller market?
Thermal renewable applications accounted for 65% of the sub-100 MW market excluding China and Japan in 2025, compared with 66% in 2021. The one-percentage-point change indicates that thermal renewables retained their leading position while the segment's volume returned to 7.0 GW in 2025.
Triveni says fossil-fuel applications had broadly stabilised as global energy requirements increased. Its presentation identifies biomass, waste-to-energy, waste-heat recovery and geothermal as renewable power-generation applications. Listed biomass fuels include bagasse, palm oil, residues, wood pellets and rice husk, while waste-to-energy includes industrial and municipal waste. The 65% figure is a market fuel-mix measure, not a disclosed Triveni revenue, order or installation share.
Which Triveni products address the sub-100 MW market?
Triveni addresses industrial and renewable heat-and-power applications below 100 MW through condensing steam turbines, backpressure steam turbines and American Petroleum Institute, or API, steam turbines for drive applications. Its disclosed power-generation capability is up to 100 MW, with steam inlet temperatures up to 545°C and inlet pressures up to 140 Bar(a).
The company lists renewable generation, combined-cycle power plants and combined heat-and-power uses across industries including sugar and distillery, food processing, pulp and paper, cement, steel, chemicals and petroleum refining. Triveni reports more than 6,000 installations in over 80 countries, representing more than 16 GW of power-generation capacity. Those cumulative installation measures are distinct from the annual GW market volumes in the McCoy data.
Conclusion
The central comparison is that the global steam-turbine market expanded from 60 GW in 2021 to 116 GW in 2025, while the sub-100 MW market excluding China and Japan finished at the same 7.0 GW level at which it began. The above-100 MW segment increased from 20.5 GW to 53.0 GW, accounting for most of the regional expansion.
The next reported market data will show whether the sub-100 MW segment moves above 7.0 GW and whether thermal renewables remain near their 65% share. Readers should also watch whether Triveni reconciles the 2024 discrepancy between the 6.1 GW total in its size-band table and the 5.6 GW total shown in its separate market-size table; the presentation provides no market target beyond 2025.