










Triveni Turbine exports reach 58% of sales in fiscal 2026
Key highlights
- Exports accounted for 58% of Triveni Turbine sales in FY26, up from 30% in FY22.
- Domestic sales represented 42% in FY26, compared with 70% in FY22.
- FY26 revenue from operations rose to Rs 2,181.1 crore from Rs 2,005.8 crore in FY25.
- H1 FY27 order booking reached Rs 1,333 crore, with exports contributing 56%.
powered by IRIS
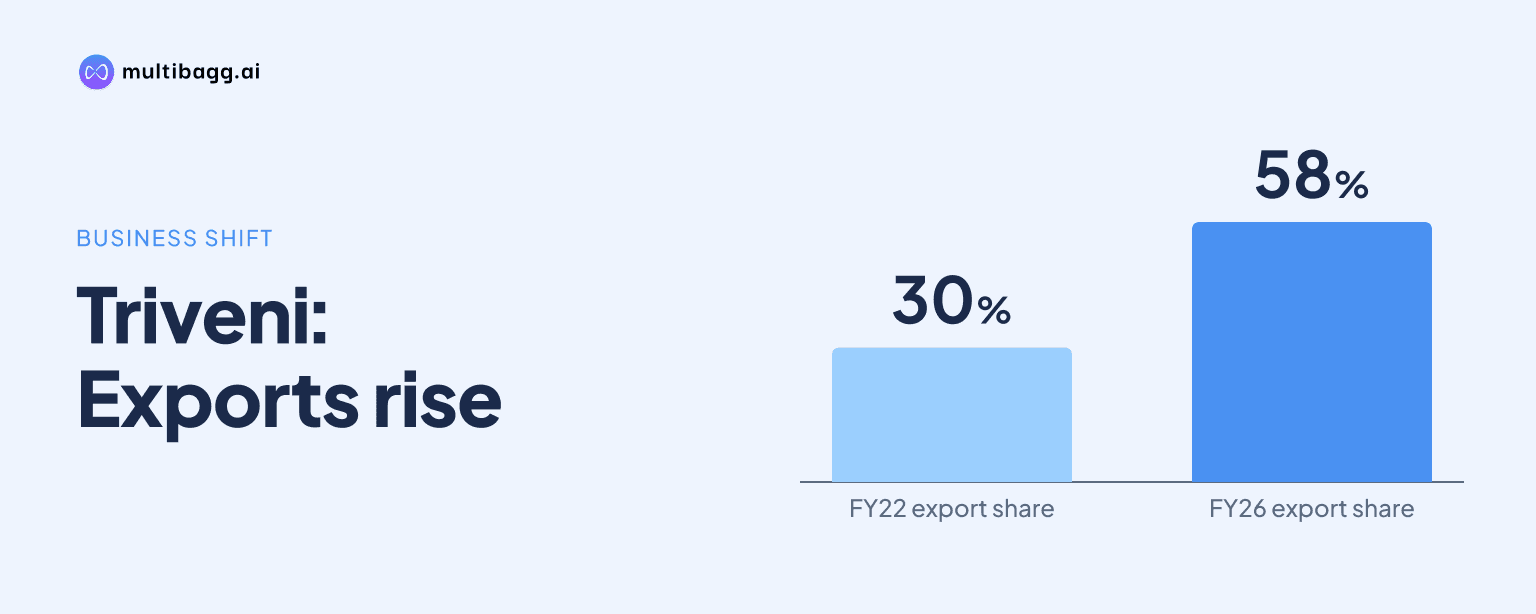
Triveni Turbine Limited derived 58% of sales from exports in FY26, up from 30% in FY22, making overseas sales larger than domestic sales at 42%. Revenue from operations rose to Rs 2,181.1 crore in FY26 from Rs 2,005.8 crore in FY25, while order booking declined to Rs 2,325.6 crore.
Know Triveni Turbine inside out
Results, valuation, peers and who's buying, in one view.
How did Triveni Turbine’s export mix change?
Triveni Turbine increased exports’ sales share by 28 percentage points between FY22 and FY26, while domestic sales declined by the same amount to 42%. Exports represented 45% of sales in FY23, 46% in FY24 and 48% in FY25 before reaching 58% in FY26. FY26 was the first year in the five-year series when exports exceeded domestic sales.
The largest annual movement came in FY23, when exports gained 15 percentage points from FY22 and domestic sales fell from 70% to 55%. Export share then added 3 percentage points across FY24 and FY25 combined, followed by a 10-percentage-point increase in FY26. The presentation describes the shift as diversification and does not disclose export sales in rupee terms.
Triveni Turbine’s revenue base expanded during this change in geography. Revenue from operations increased from Rs 852.2 crore in FY22 to Rs 2,181.1 crore in FY26, for the 26% compound annual growth rate, or CAGR, stated by the company. Revenue rose by Rs 175.3 crore in FY26, compared with an increase of Rs 351.9 crore in FY25, showing that growth moderated in the final year of the series.
How did Triveni Turbine’s product and aftermarket mix change?
Triveni Turbine’s product sales remained 73% of the total in both FY22 and FY26, even as the geographic sales mix moved towards exports. Aftermarket sales were 27% in FY26, the same proportion as FY22, so the reported four-year change was in domestic and export allocation rather than the final product-aftermarket balance.
Aftermarket share rose to 33% in FY23 and FY24, then reduced to 32% in FY25 and 27% in FY26. Product share moved in the opposite direction, recovering from 67% in FY23 and FY24 to 73% in FY26. The presentation reports product-aftermarket and domestic-export splits separately, so it does not identify how much of the export shift was generated by each business.
The FY26 combination of a 58% export share and a 73% product share shows that both measures describe different dimensions of sales. Product business was the larger reported sales category, while exports were the larger geographic category. No domestic or export revenue amounts are supplied for product and aftermarket sales.
Got a follow-up? Ask IRIS
Did Triveni Turbine’s financial growth moderate in FY26?
Triveni Turbine’s revenue and earnings before interest, tax, depreciation and amortisation, or EBITDA, increased in FY26, but order booking and profit after tax, or PAT, were below FY25. Revenue increased by Rs 175.3 crore to Rs 2,181.1 crore, while order booking fell by Rs 37.1 crore to Rs 2,325.6 crore and PAT declined by Rs 9.2 crore to Rs 349.4 crore.
EBITDA rose by Rs 9.1 crore in FY26, although its margin declined to 24.2% from 25.8% in FY25. Profit before tax, or PBT, was Rs 490.1 crore in FY26 against Rs 488.5 crore in FY25, while PBT margin reduced from 24.3% to 22.5%. The FY26 PBT figure excludes an exceptional expense of Rs 15.7 crore.
PAT margin declined to 16.0% in FY26 from 17.9% in FY25. FY26 PAT includes the Rs 15.7 crore one-time exceptional expense, while FY22 PAT included Rs 198.2 crore of one-time exceptional income. The company’s stated FY22-to-FY26 PAT CAGR is 7%, a period that includes those exceptional items.
What did management report for FY27 exports and orders?
Triveni Turbine said H1 FY27 revenue grew 6.4% year on year to Rs 934 crore, while Q2 FY27 revenue declined 3.0% year on year to Rs 491 crore. Management attributed the Q2 result to domestic revenue growth of 51.8% being offset by lower export revenue during the quarter.
Management reported record Q2 FY27 order booking of Rs 764 crore, up 17.2% year on year, with export order booking increasing 49.8%. H1 FY27 order booking was also a record Rs 1,333 crore, up 12.2% year on year, with exports contributing 56% and aftermarket contributing 29%. These are order-booking shares rather than reported sales shares.
Triveni Turbine’s closing order book stood at Rs 2,453 crore at the end of Q2 FY27, up 10.5% year on year. The aftermarket order book more than doubled to Rs 639 crore, following contract wins in thermal renewables, combined-cycle and utility segments, according to management. Management said its international enquiry pipeline includes biomass, waste-to-energy, utility, geothermal and process co-generation applications.
Management attributed Q2 FY27 margin pressure to deliveries against orders secured about a year earlier, less favourable product mix, execution of a strategic order, and higher input and logistics costs. It said these pressures should ease in coming quarters and that performance should improve in H2 FY27. This is management’s outlook rather than a reported financial result or target.
Conclusion
Triveni Turbine’s FY22-to-FY26 data show a material change in sales geography, with export share rising from 30% to 58% while domestic share fell from 70% to 42%. This occurred alongside revenue growth from Rs 852.2 crore to Rs 2,181.1 crore, although FY26 brought lower order booking, lower EBITDA margin and lower PAT than FY25.
The next disclosed period to watch is H2 FY27, when management expects improvement after Q2 cost and mix pressures. The reported Rs 2,453 crore closing order book, 56% export share of H1 FY27 order booking and Rs 639 crore aftermarket order book provide the disclosed measures against which subsequent revenue, margins and sales mix can be assessed.