










True Colors Limited revenue rose 3.7 times as cash reversed
Key highlights
- TCL revenue from operations rose 3.7 times to Rs 301.55 crore in FY26 from Rs 80.66 crore in FY23.
- Fabric and machine revenue added Rs 60.03 crore of TCL’s Rs 68.89 crore FY26 segment-revenue increase.
- TCL’s FY26 EBITDA margin declined to 15.58% from 17.52%, while return on equity fell to 16% from 44%.
- TCL reported Rs 34.99 crore of negative operating cash flow and Rs 64.61 crore of investing cash outflow in FY26.],
powered by IRIS
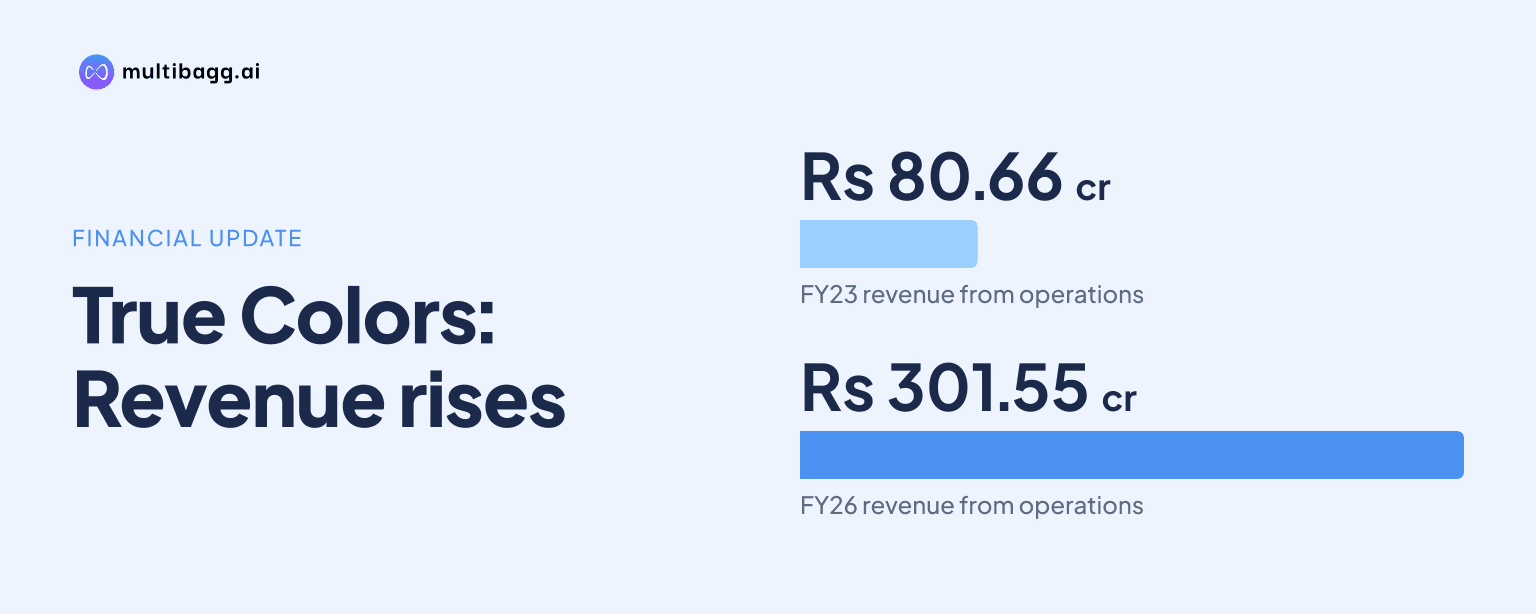
True Colors Limited increased revenue from operations to Rs 301.55 crore in FY26 from Rs 80.66 crore in FY23, a 3.7-times increase over three years. However, TCL reported a Rs 34.99 crore operating-cash-flow outflow in FY26, while trade receivables rose to Rs 111.12 crore and investing cash outflow reached Rs 64.61 crore.
Know True Colors inside out
Results, valuation, peers and who's buying, in one view.
How fast did TCL’s revenue and profit grow through FY26?
TCL’s revenue from operations rose by Rs 220.89 crore between FY23 and FY26, reaching Rs 301.55 crore from Rs 80.66 crore. Profit after tax increased to Rs 31.16 crore in FY26 from Rs 3.95 crore in FY23, while gross profit rose from Rs 19.19 crore to Rs 81.99 crore over the same period.
TCL’s growth rate moderated in FY26 relative to FY25, although each reported profit measure still rose. Revenue increased by Rs 68.18 crore in FY26 after a Rs 73.84 crore increase in FY25; earnings before interest, tax, depreciation and amortisation, or EBITDA, increased by Rs 6.09 crore after a Rs 26.46 crore gain in the prior year. Profit after tax rose by Rs 6.93 crore in FY26, compared with Rs 15.98 crore in FY25.
Which TCL businesses drove FY26 revenue growth?
TCL’s fabric and machine verticals produced most of the FY26 increase in reported segment revenue. Fabric revenue rose to Rs 89.09 crore from Rs 66.12 crore in FY25, and machine revenue reached Rs 60.94 crore from Rs 23.88 crore. Together, these two businesses added Rs 60.03 crore, compared with a total segment-revenue increase of Rs 68.89 crore.
Paper revenue changed little, increasing by Rs 0.89 crore to Rs 66.79 crore, while inks added Rs 3.08 crore to Rs 74.57 crore. Fabric became TCL’s largest vertical by FY26 revenue, accounting for 29.54% of total revenue versus 11.32% in FY24. Machines represented 20.21% of revenue in FY26 after accounting for 10.22% in FY25, while paper’s share declined from 28.20% to 22.15%.
Operational volumes also increased across the four verticals. Digitally printed fabric volume reached 205 lakh metres in FY26, up from 132 lakh metres in FY25 and 28 lakh metres in FY24. New machine installations increased to 109 from 89, while ink volume sold rose to 1,140 tonnes from 957 tonnes and sublimation-paper throughput grew to 12 crore metres from 9 crore metres.
What happened to TCL’s margins and returns in FY26?
TCL reported higher absolute profit in FY26, but gross and EBITDA margins declined from FY25 levels. Gross margin was 27.19% in FY26, compared with 27.86% in FY25, and EBITDA margin was 15.58%, compared with 17.52%. Profit after tax margin was broadly unchanged at 10.33%, against 10.38% a year earlier.
The margin movement coincided with cost of goods sold increasing to Rs 208.22 crore from Rs 162.62 crore and operating expenses rising to Rs 46.61 crore from Rs 30.34 crore. Finance cost also increased to Rs 5.40 crore from Rs 4.69 crore, while depreciation rose to Rs 4.73 crore from Rs 3.43 crore. These changes occurred alongside a Rs 68.18 crore rise in revenue from operations.
Reported return measures fell in FY26 despite the increase in earnings. Return on capital employed declined to 22% from 36% in FY25, and return on equity fell to 16% from 44%. TCL’s total equity and liabilities increased to Rs 286.66 crore in FY26 from Rs 154.98 crore, while tangible assets rose to Rs 79.63 crore from Rs 47.32 crore.
Got a follow-up? Ask IRIS
Why did TCL report negative operating cash flow in FY26?
TCL reported cash flow from operating activities of negative Rs 34.99 crore in FY26, reversing positive operating cash flow of Rs 9.15 crore in FY25 and Rs 14.75 crore in FY24. The outflow was recorded despite FY26 profit after tax of Rs 31.16 crore, meaning reported earnings were not matched by positive operating cash flow during the year.
The balance sheet shows growth in working-capital items alongside the revenue expansion. Trade receivables nearly doubled to Rs 111.12 crore in FY26 from Rs 56.60 crore in FY25, an increase of Rs 54.52 crore. Inventories increased by Rs 7.08 crore to Rs 42.99 crore, while trade payables rose by Rs 11.38 crore to Rs 48.51 crore.
The cash-flow summary does not provide a line-by-line reconciliation of the operating outflow to receivables, inventory or other working-capital movements. Receivables and inventories combined rose by Rs 61.60 crore in FY26, while revenue from operations increased by Rs 68.18 crore. Cash and bank balances ended FY26 at Rs 1.27 crore, compared with Rs 7.26 crore at the beginning of the year.
What were TCL’s FY26 investing and financing cash flows?
TCL recorded investing cash outflow of Rs 64.61 crore in FY26, compared with Rs 11.66 crore in FY25 and Rs 39.78 crore in FY24. This was the largest annual investing outflow in the four-year cash-flow summary and coincided with a Rs 32.31 crore increase in tangible assets, to Rs 79.63 crore at FY26 end.
Financing cash inflow was Rs 93.61 crore in FY26, compared with Rs 2.87 crore in FY25. Short-term borrowings rose to Rs 37.81 crore from Rs 24.67 crore, while long-term borrowings fell to Rs 8.15 crore from Rs 22.84 crore. Equity share capital increased to Rs 24.65 crore from Rs 18.96 crore and other equity rose to Rs 162.48 crore from Rs 36.54 crore.
TCL’s cash-flow table also contains a disclosed comparison point requiring clarification in later reporting. It lists cash at the end of FY25 as Rs 5.41 crore, but lists cash at the beginning of FY26 as Rs 7.26 crore. The FY26 table reports net cash flow of negative Rs 5.99 crore and closing cash of Rs 1.27 crore.
Conclusion
TCL’s FY26 record combines rapid scale-up with a more cash-intensive balance sheet. Revenue was 3.7 times FY23’s level and profit after tax reached Rs 31.16 crore, led by fabric and machine revenue growth. At the same time, receivables reached Rs 111.12 crore, operating cash flow turned negative Rs 34.99 crore and investing outflow rose to Rs 64.61 crore.
The presentation’s H1 FY27 figures show revenue of Rs 183.01 crore, up 21.11% year on year, and an EBITDA margin of 17.67%, up 240 basis points. Subsequent reporting will need to clarify the differing FY25 closing-cash and FY26 opening-cash figures, and show how receivables, investment spending and operating cash flow develop with revenue growth.