










TVS SCS Q2 PAT more than doubles as EBITDA margin hits 7.3%
Key highlights
- TVS SCS Q2 FY27 revenue rose 38.5% year on year to Rs 3,687 crore.
- TVS SCS Q2 FY27 PAT increased 123.9% year on year to Rs 37 crore.
- TVS SCS adjusted EBITDA margin increased to 7.3% in Q2 FY27 from 6.7% in Q2 FY26.
- TVS SCS H1 FY27 operating cash flow was Rs 234 crore.
powered by IRIS
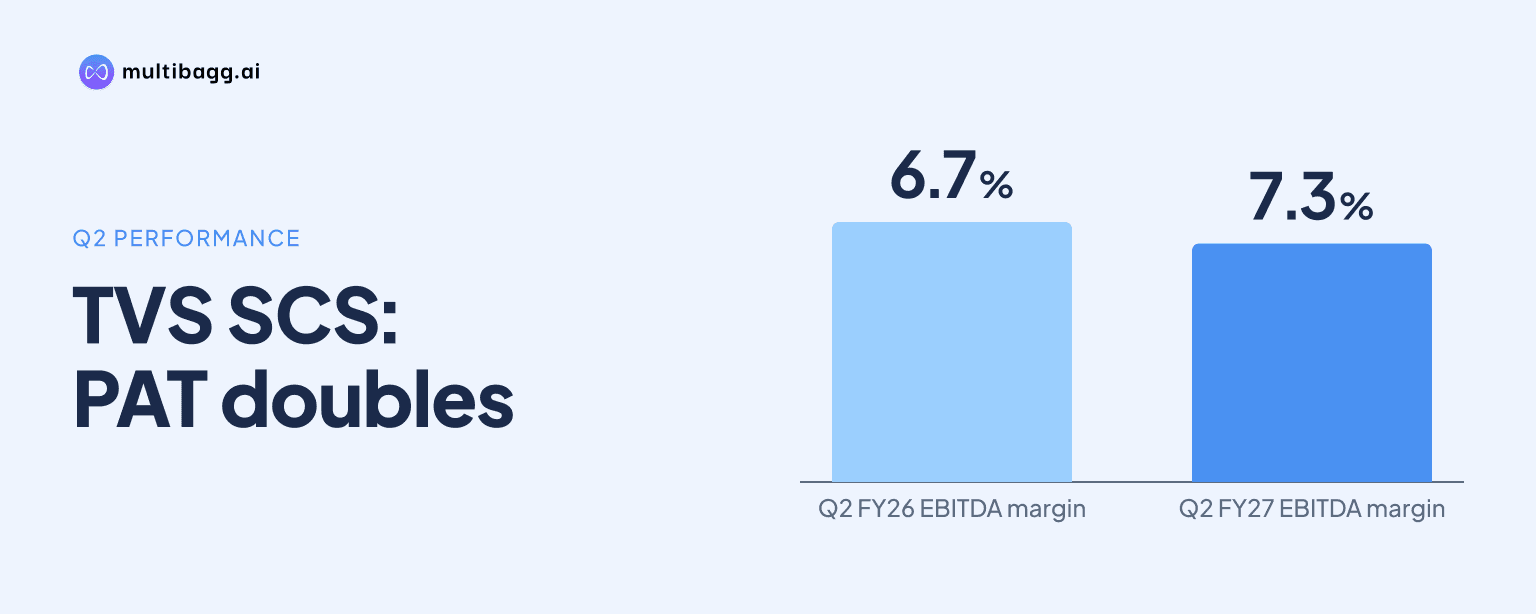
TVS Supply Chain Solutions reported Q2 FY27 profit after tax of Rs 37 crore, up 123.9% year on year, while adjusted EBITDA margin increased 60 basis points to 7.3%. Revenue rose 38.5% to Rs 3,687 crore, showing profit after tax, pre-tax earnings and operating profit all grew faster than sales.
Know TVS Supply Chain Solutions inside out
Results, valuation, peers and who's buying, in one view.
How did TVS SCS perform in Q2 FY27?
TVS SCS delivered Rs 3,687 crore of consolidated revenue in Q2 FY27, Rs 268 crore of adjusted earnings before interest, tax, depreciation and amortisation (EBITDA), Rs 51 crore of profit before tax (PBT), and Rs 37 crore of profit after tax (PAT). Compared with Q2 FY26, revenue increased from Rs 2,663 crore, while EBITDA rose from Rs 178 crore, PBT from Rs 24 crore, and PAT from Rs 16 crore.
The quarterly growth rates show that earnings expanded more rapidly than sales. Revenue grew 38.5% year on year, compared with EBITDA growth of 50.2%, PBT growth of 107.6%, and PAT growth of 123.9%. On a sequential basis, Q2 FY27 revenue was 10.6% higher than Q1 FY27 revenue of Rs 3,335 crore, while EBITDA increased 15.5% from Rs 232 crore.
Which TVS SCS margins expanded in Q2 FY27?
TVS SCS expanded each reported consolidated margin in Q2 FY27: adjusted EBITDA margin reached 7.3%, PBT margin reached 1.4%, and PAT margin reached 1.0%. EBITDA margin was 6.7% in Q2 FY26 and 7.0% in Q1 FY27, so the Q2 FY27 result was 60 basis points higher year on year and 30 basis points above the preceding quarter. A basis point is one-hundredth of a percentage point.
PBT margin increased from 0.9% in Q2 FY26 and 1.0% in Q1 FY27 to 1.4% in Q2 FY27. PAT margin similarly increased from 0.6% and 0.7%, respectively, to 1.0%. The presentation defines EBITDA as adjusted for employee stock option plan expenses and redundancy costs, while Q2 FY26 PBT is stated before redundancy costs, which is relevant when comparing the reported earnings measures.
The improvement in margins coincided with a Rs 90 crore year-on-year increase in adjusted EBITDA and a Rs 21 crore increase in PAT. Management attributed the Q2 EBITDA margin improvement to execution and tighter cost control across regions, while describing revenue momentum as broad-based across new and existing accounts. The figures do not separate the contribution of each cost measure to the 7.3% consolidated EBITDA margin.
Which segment drove TVS SCS earnings growth?
Both operating segments increased EBITDA in Q2 FY27, but Global Freight Solutions (GFS) recorded the faster percentage growth while Integrated Supply Chain Solutions (ISCS) generated the larger absolute EBITDA. ISCS EBITDA rose 31.2% year on year to Rs 228 crore from Rs 174 crore, and GFS EBITDA rose 218.9% to Rs 47 crore from Rs 15 crore.
ISCS revenue reached Rs 2,488 crore in Q2 FY27, up 24.8% from Rs 1,993 crore in Q2 FY26 and 2.9% from Rs 2,417 crore in Q1 FY27. Its EBITDA margin rose to 9.2%, from 8.7% a year earlier and 8.1% in Q1 FY27. Management said ISCS margins expanded across regions, supported by top-line momentum and operational rigor.
GFS revenue increased 79.1% year on year to Rs 1,199 crore in Q2 FY27, versus Rs 670 crore in Q2 FY26, and was 30.6% above Rs 918 crore in Q1 FY27. Its EBITDA margin reached 3.9%, up from 2.2% a year earlier but below 4.1% in Q1 FY27. Management cited sustainable volume increases and procurement efficiencies for GFS profitability, while its Q2 EBITDA rose Rs 9 crore sequentially from Rs 38 crore.
Got a follow-up? Ask IRIS
What does H1 FY27 show about TVS SCS profitability?
TVS SCS reported H1 FY27 revenue of Rs 7,022 crore, up 33.6% from Rs 5,255 crore in H1 FY26, while adjusted EBITDA increased 42.2% to Rs 500 crore. H1 EBITDA margin consequently rose to 7.1% from 6.7%, extending the margin improvement seen in the Q2 FY27 comparison.
H1 PBT increased 91.4% to Rs 83 crore from Rs 43 crore, and H1 PAT increased 134.7% to Rs 59 crore from Rs 25 crore. PBT margin was 1.2%, compared with 0.8% in H1 FY26, while PAT margin reached 0.8%, compared with 0.5%. The H1 PAT comparison is adjusted to exclude InvIT gains and exceptional items in H1 FY26, according to the presentation.
Segment results show GFS was the faster-growing business over the half year. H1 GFS revenue rose 65.5% to Rs 2,117 crore and EBITDA increased 207.9% to Rs 85 crore, with margin rising from 2.1% to 4.0%. H1 ISCS revenue rose 23.4% to Rs 4,905 crore and EBITDA grew 25.6% to Rs 424 crore, with margin increasing from 8.5% to 8.7%.
What supported TVS SCS revenue growth and what is management targeting?
TVS SCS attributed Q2 FY27 revenue growth to Rs 523 crore of new-business revenue, Rs 74 crore of inorganic growth from the Swamy & Sons acquisition, and Rs 659 crore from price, volume and other factors. These additions were partly offset by Rs 232 crore of customer churn, taking revenue from Rs 2,663 crore in Q2 FY26 to Rs 3,687 crore in Q2 FY27. New-business revenue equalled 19.7% of Q2 FY26 revenue.
For H1 FY27, new business contributed Rs 1,067 crore, inorganic growth contributed Rs 104 crore, and price, volume and other factors added Rs 954 crore. Customer churn reduced revenue by Rs 358 crore in the H1 bridge, with reported revenue reaching Rs 7,022 crore. Management said the Swamy & Sons acquisition, completed in the preceding quarter, was fully funded from internal accruals and was margin accretive in H1 FY27.
Management said it had a business-development pipeline of Rs 8,200 crore and a steady conversion rate, and is targeting revenue growth of more than 20% across both segments. It also said it was on track to double profits in FY27, citing broad-based ISCS momentum and structural enhancements in GFS. These are management targets and statements of confidence rather than reported FY27 outcomes.
Conclusion
TVS SCS's Q2 FY27 figures show a broad earnings expansion: revenue increased 38.5%, adjusted EBITDA rose 50.2%, and PAT rose 123.9%. The 7.3% EBITDA margin, 1.4% PBT margin and 1.0% PAT margin were each above both Q2 FY26 and Q1 FY27 levels, while ISCS increased its margin to 9.2% and GFS lifted its year-on-year margin to 3.9%.
The key measure against management's plan is conversion of its Rs 8,200 crore business-development pipeline toward revenue growth of more than 20% in both segments and its stated objective of doubling profits in FY27. Management's disclosed factors to monitor include GFS procurement efficiencies and volume growth, customer churn of Rs 358 crore in H1 FY27, and the Rs 140 crore increase in gross debt used primarily to fund working capital for GFS growth.