










TVS Supply Chain Solutions H1 cash flow falls on working capital
Key highlights
- TVS Supply Chain Solutions generated Rs 234.0 crore of net operating cash in H1 FY27, down from Rs 341.9 crore in H1 FY26.
- Working capital used Rs 264.9 crore in H1 FY27, compared with a Rs 24.3 crore outflow a year earlier.
- Trade receivables including unbilled revenue rose Rs 603.5 crore to Rs 2,799.6 crore at September 2026.
- Borrowings increased Rs 139.6 crore to Rs 1,249.9 crore between March and September 2026.
powered by IRIS
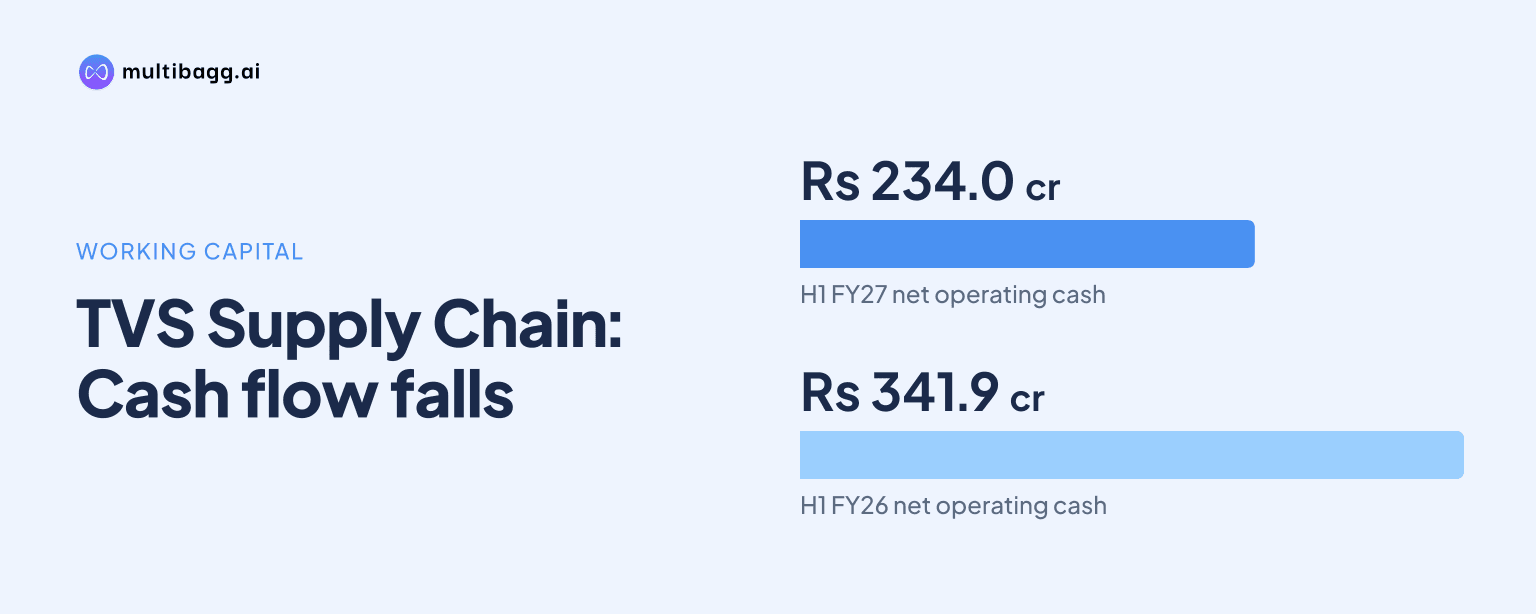
TVS Supply Chain Solutions Limited reported Rs 234.0 crore of net operating cash flow in H1 FY27, down from Rs 341.9 crore a year earlier, after working capital used Rs 264.9 crore despite operating profit before working-capital changes rising to Rs 527.8 crore. Trade receivables rose Rs 603.5 crore between March and September 2026, while borrowings increased Rs 139.6 crore.
Know TVS Supply Chain Solutions inside out
Results, valuation, peers and who's buying, in one view.
Why did TVS Supply Chain Solutions' H1 operating cash flow fall?
TVS Supply Chain Solutions' H1 FY27 operating cash flow fell because working capital consumed Rs 264.9 crore, compared with an outflow of Rs 24.3 crore in H1 FY26. Cash generated from operations was Rs 262.9 crore in H1 FY27, down Rs 105.7 crore from Rs 368.6 crore in the prior-year period, despite operating profit before working-capital changes increasing by Rs 134.9 crore.
Net cash from operating activities was Rs 234.0 crore in H1 FY27 after Rs 28.9 crore of direct taxes paid, net of refunds. In H1 FY26, operating cash flow was Rs 341.9 crore after tax payments of Rs 26.7 crore, making the year-on-year reduction in net operating cash Rs 107.9 crore.
How did TVS Supply Chain Solutions' working capital change in H1 FY27?
TVS Supply Chain Solutions recorded a Rs 264.9 crore working-capital outflow in H1 FY27, Rs 240.6 crore larger than the Rs 24.3 crore outflow in H1 FY26. The cash-flow statement reports the net movement only and does not allocate it separately among receivables, inventory, payables and other balance-sheet accounts.
Trade receivables, including unbilled revenue, stood at Rs 2,799.6 crore in September 2026, up Rs 603.5 crore from Rs 2,196.1 crore in March 2026. Inventories rose Rs 41.1 crore to Rs 574.4 crore and other assets increased Rs 121.3 crore to Rs 719.6 crore, while trade payables increased Rs 308.0 crore to Rs 2,095.8 crore. These movements provide context for the net cash requirement, although the presentation does not disclose receivable days or payment days.
What changed in TVS Supply Chain Solutions' balance sheet?
TVS Supply Chain Solutions' total assets increased Rs 668.2 crore to Rs 7,868.1 crore in September 2026 from Rs 7,199.9 crore in March 2026. The Rs 603.5 crore rise in trade receivables was the largest asset movement, followed by the Rs 121.3 crore increase in other assets and a Rs 32.3 crore increase in intangible assets, including goodwill, to Rs 867.9 crore.
Borrowings rose to Rs 1,249.9 crore in September 2026 from Rs 1,110.3 crore in March 2026, while total equity increased Rs 74.7 crore to Rs 2,137.0 crore. Lease liabilities were nearly unchanged at Rs 1,643.3 crore, compared with Rs 1,645.1 crore six months earlier. Cash and bank balances declined Rs 111.1 crore to Rs 612.9 crore over the same period.
Got a follow-up? Ask IRIS
How did operating profit compare with cash generation for TVS Supply Chain Solutions?
TVS Supply Chain Solutions increased operating profit before working-capital changes to Rs 527.8 crore in H1 FY27 from Rs 392.9 crore in H1 FY26, but the increase did not translate into higher operating cash because the working-capital outflow expanded. Adjustments for non-cash items and other investment or financial items were Rs 445.1 crore in H1 FY27, compared with Rs 266.2 crore a year earlier.
Earnings before interest, tax, depreciation and amortisation, excluding other income, rose 42.2% to Rs 500.3 crore in H1 FY27 from Rs 351.5 crore in H1 FY26. The EBITDA margin increased to 7.1% from 6.7%, while revenue from operations rose 33.6% to Rs 7,022.4 crore. Operational profit after tax was Rs 59.0 crore versus Rs 25.1 crore, while reported profit after tax was Rs 59.0 crore versus Rs 87.5 crore because H1 FY26 included a Rs 177.2 crore TVS ILP InvIT gain and Rs 91.3 crore of exceptional items.
What did investing and financing cash flows do in H1 FY27?
TVS Supply Chain Solutions used Rs 77.9 crore in investing activities in H1 FY27, compared with an outflow of Rs 121.1 crore in H1 FY26. The H1 FY27 amount included Rs 102.3 crore of capital expenditure and Rs 59.6 crore for the acquisition of Swamy and Sons, partly offset by Rs 84.0 crore from other investing activities.
Financing activities used Rs 195.9 crore in H1 FY27, compared with Rs 155.2 crore in H1 FY26. Payments of principal and interest on lease liabilities increased to Rs 278.2 crore from Rs 236.9 crore, while other financing activities provided Rs 82.3 crore, compared with Rs 81.7 crore a year earlier. Net cash and cash equivalents declined Rs 39.8 crore before a Rs 7.7 crore foreign-exchange difference, ending at Rs 580.7 crore versus Rs 632.1 crore at the end of H1 FY26.
Conclusion
TVS Supply Chain Solutions delivered higher H1 FY27 revenue, EBITDA and operating profit before working-capital changes, but its operating cash flow fell to Rs 234.0 crore as working capital used Rs 264.9 crore. The Rs 603.5 crore increase in trade receivables, alongside increases in inventory and other assets, occurred while trade payables rose Rs 308.0 crore and borrowings increased Rs 139.6 crore.
The unresolved issue is whether receivables, payables and other working-capital balances change as FY27 progresses. Management expects the strong trend in ISCS India to continue into FY27, expects North America growth to gain momentum after execution of a large H2 FY26 project, and says it continues to watch the geopolitical environment for the GFS business.