










Uniparts construction-equipment mix reaches 45.8% in H1 FY27 sales
Key highlights
- Uniparts' construction-equipment share rose to 45.8% in H1 FY27 from 36.9% in FY25.
- Agriculture represented 54.2% of Uniparts' H1 FY27 finished-goods sales, down from 63.1% in FY25.
- PMP accounted for 55.0% of Uniparts' H1 FY27 finished-goods sales, while 3PL accounted for 43.1%.
- Uniparts' H1 FY27 total income increased 31.5% year on year to Rs 738.9 crore.
powered by IRIS
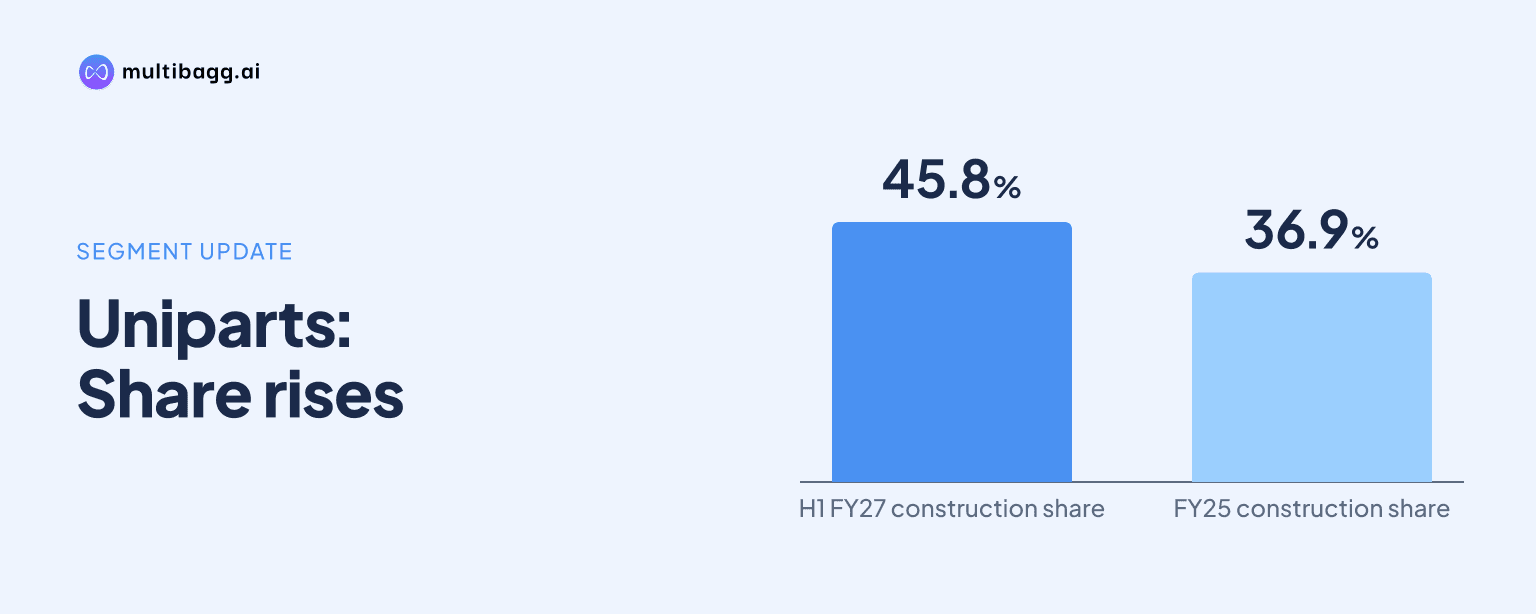
Uniparts Group reported that construction equipment, labelled CFM in its presentation, accounted for 45.8% of finished-goods sales in H1 FY27, up from 36.9% in FY25, while agriculture declined to 54.2% from 63.1%. The 8.9-percentage-point movement coincided with H1 FY27 total income of Rs 738.9 crore.
Know Uniparts India inside out
Results, valuation, peers and who's buying, in one view.
How did Uniparts' end-market revenue mix change?
Uniparts' construction-equipment share increased by 8.9 percentage points between FY25 and H1 FY27, while agriculture's share fell by the same amount. Construction equipment represented 36.9% of finished-goods sales in FY25, 38.7% in FY26 and 45.8% in H1 FY27. Agriculture moved from 63.1% in FY25 to 61.3% in FY26 and 54.2% in H1 FY27. The two segments together totalled 100% in each reported period.
The change accelerated in the latest half year relative to the full-year comparison. Construction equipment gained 1.8 percentage points from FY25 to FY26, then gained a further 7.1 percentage points by H1 FY27. Agriculture's decline similarly moved from 1.8 percentage points in FY26 to another 7.1 percentage points by H1 FY27. The presentation reports revenue distribution as a percentage of finished-goods sales, rather than reporting rupee revenue separately for agriculture and CFM.
How did Uniparts' product mix change in H1 FY27?
Uniparts' precision machine parts, or PMP, rose to 55.0% of finished-goods sales in H1 FY27, while three point linkage, or 3PL, declined to 43.1%. PMP was 48.6% in FY25 and 51.5% in FY26, making its H1 FY27 share 6.4 percentage points above FY25. In contrast, 3PL was 48.8% in FY25 and 46.6% in FY26, leaving its H1 FY27 proportion 5.7 percentage points below FY25.
The smaller product categories remained limited in the reported mix. Power take-off, or PTO, was 0.7% in H1 FY27, compared with 1.1% in both FY25 and FY26. Fabrication was 1.2% in H1 FY27, compared with 1.5% in FY25 and 0.8% in FY26. The presentation recorded others at 0.0% in H1 FY27. Uniparts identifies 3PL, PMP, PTO, fabrication and hydraulic cylinders as product categories, while noting it undertakes small- and medium-scale fabrication, PTO and hydraulic components.
Where did Uniparts' geographic sales mix shift?
Uniparts' Americas share increased to 59.3% of finished-goods sales in H1 FY27 from 54.6% in FY25, while Europe declined to 21.3% from 23.6%. The Americas had accounted for 53.2% in FY26, so its H1 FY27 share was 6.1 percentage points above the preceding full year. Europe was 24.7% in FY26, making the H1 FY27 reading 3.4 percentage points lower.
India represented 12.7% of H1 FY27 finished-goods sales, down from 14.9% in FY25 and 14.3% in FY26. Japan was 4.8% in H1 FY27, compared with 4.5% in FY25 and 5.2% in FY26, while the Rest of the World was 1.9%, compared with 2.4% and 2.6%, respectively. The latest geographic distribution therefore showed a 4.7-percentage-point rise in the Americas share from FY25, offset by lower reported proportions in Europe, India and the Rest of the World.
Got a follow-up? Ask IRIS
What was Uniparts' OEM and aftermarket sales mix?
Uniparts derived 85.5% of finished-goods sales from original equipment manufacturers, or OEMs, in H1 FY27, versus 14.5% from the aftermarket, or AFM. OEMs represented 80.7% in FY25 and 85.0% in FY26. The H1 FY27 result was therefore 4.8 percentage points above FY25 and 0.5 percentage points above FY26.
Uniparts' AFM share moved in the opposite direction, from 19.3% in FY25 to 15.0% in FY26 and 14.5% in H1 FY27. The 4.8-percentage-point decline from FY25 matches the increase in OEM share because the two channels comprise the reported market-presence split. The presentation does not provide individual customer names, contract values or channel-specific revenue in rupees for H1 FY27, so the disclosed evidence is limited to the percentage distribution.
How did Uniparts' H1 FY27 financial results compare with H1 FY26?
Uniparts reported H1 FY27 total income of Rs 738.9 crore, up 31.5% from Rs 561.9 crore in H1 FY26, while profit after tax rose 50.4% to Rs 111 crore. Earnings before interest, tax, depreciation and amortisation, or EBITDA, increased 46.5% to Rs 178.4 crore from Rs 121.8 crore. Profit before tax increased 54.9% to Rs 147.4 crore.
Margins also rose on the half-year comparison. EBITDA margin was 24.1% in H1 FY27, compared with 21.7% in H1 FY26, and profit after tax margin was 15.0%, compared with 13.1%. In Q2 FY27, however, EBITDA was Rs 88.6 crore, 1.3% lower than Rs 89.8 crore in Q1 FY27, while the EBITDA margin declined to 23.1% from 25.3%. Q2 total income was Rs 383.7 crore, 8.0% above Rs 355.2 crore in Q1 FY27.
Conclusion
Uniparts' H1 FY27 distribution shows that construction equipment reached 45.8% of finished-goods sales, narrowing the gap with agriculture, which stood at 54.2%. The end-market movement occurred alongside a PMP share of 55.0%, an Americas share of 59.3%, an OEM share of 85.5% and H1 total-income growth of 31.5% to Rs 738.9 crore.
The next disclosed measure to watch is whether Uniparts' mix and operating performance continue to develop alongside management's long-term margin guidance of 20%. Uniparts also describes adjacent PTO, hydraulic-cylinder and fabrication offerings as a way to extend system boundaries and provide integrated solutions on the same off-highway vehicles, but does not give a future revenue target for those categories.