










V-Mart free cash flow turned negative after inventory build-up
Key highlights
- V-Mart reported negative pre-Ind AS 116 free cash flow of Rs 113.8 crore in YTD FY'27, versus positive Rs 26.6 crore a year earlier.
- Working capital absorbed Rs 93.9 crore in YTD FY'27, compared with a Rs 29.1 crore positive contribution in YTD FY'26.
- Inventory rose to Rs 1,190.4 crore at September 30, 2026 from Rs 987.5 crore at March 31, 2026.
- V-Mart opened 23 stores and closed one in Q2 FY'27, taking its network to 613 stores.
powered by IRIS
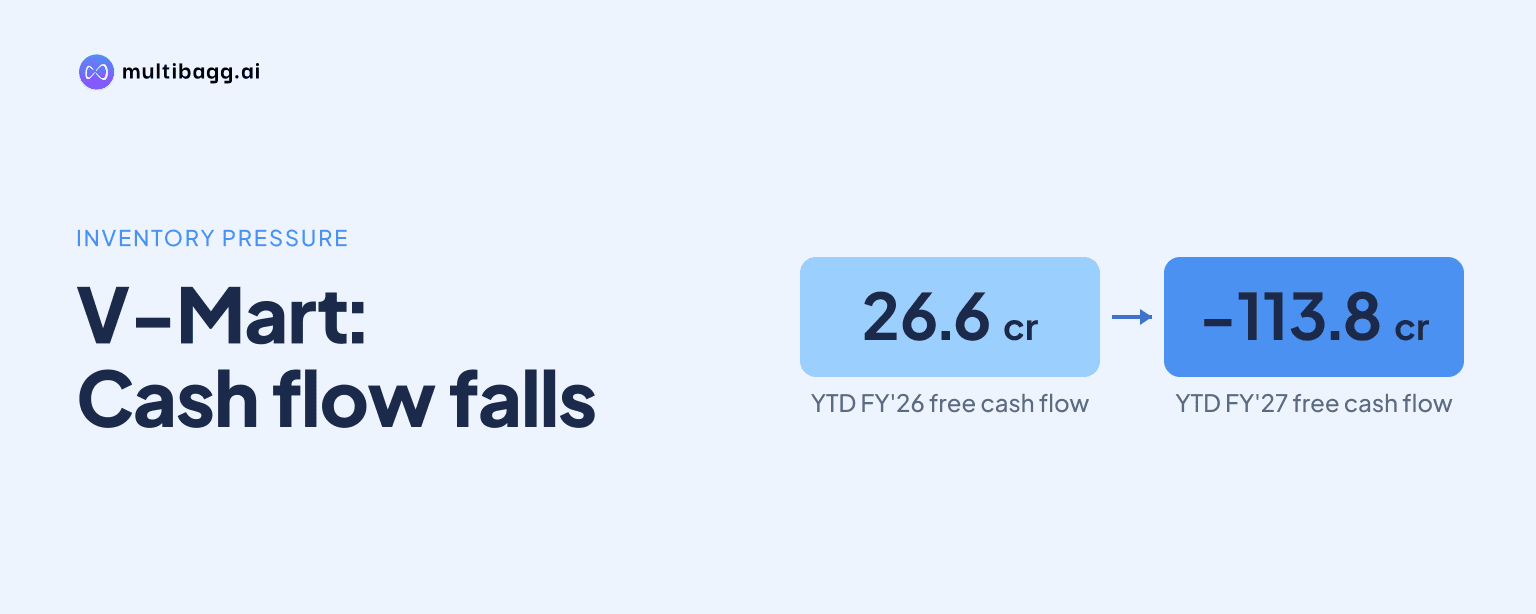
V-Mart Retail Limited generated negative pre-Ind AS 116 free cash flow of Rs 113.8 crore in YTD FY'27 ended September 30, 2026, compared with positive Rs 26.6 crore a year earlier, after working capital absorbed Rs 93.9 crore for festive inventory build-up and faster vendor payments.
Know V-Mart Retail inside out
Results, valuation, peers and who's buying, in one view.
Why did V-Mart's pre-Ind AS 116 free cash flow turn negative?
V-Mart's pre-Ind AS 116 free cash flow turned negative because its operating cash flow, after the lease-accounting adjustment, did not cover net capital expenditure and finance charges. Net cash flow from operating activities declined to Rs 140.2 crore in the period ended September 30, 2026, from Rs 232.7 crore in the comparable 2025 period. Net free cash flow was negative Rs 113.8 crore, against positive Rs 26.6 crore a year earlier.
The Indian Accounting Standard 116, or Ind AS 116, adjustment was Rs 157.6 crore in YTD FY'27, compared with Rs 131.9 crore in YTD FY'26. This converted reported operating cash flow of Rs 140.2 crore into negative pre-Ind AS 116 operating cash flow of Rs 17.4 crore. Net capital expenditure rose to Rs 84.6 crore from Rs 60 crore, while finance charges classified as others were Rs 11.8 crore, compared with Rs 14.2 crore.
How much did working capital reduce V-Mart's operating cash flow?
Working capital reduced V-Mart's cash flow by Rs 93.9 crore in YTD FY'27, compared with a Rs 29.1 crore positive contribution in the prior-year period. Operating profit before working-capital changes increased to Rs 249.2 crore from Rs 206.6 crore, but the working-capital movement reduced cash flow from operations to Rs 155.3 crore from Rs 235.7 crore.
Management attributed the absorption primarily to festive inventory build-up and faster vendor payments. The presentation says the gap between days payable outstanding, or DPO, and days of inventory, or DOI, narrowed by nine days year on year. Taxes paid, net of refunds, increased to Rs 15.1 crore from Rs 3 crore, further reducing net operating cash flow.
Inventory was Rs 1,190.4 crore at September 30, 2026, up from Rs 987.5 crore at March 31, 2026, an increase of Rs 202.9 crore. Other current assets rose to Rs 232 crore from Rs 177 crore during the same six-month balance-sheet comparison. The presentation links the inventory movement with seasonal stock preparation, but does not quantify the cash effect of individual working-capital lines.
Did V-Mart's earnings growth convert into cash in YTD FY'27?
V-Mart's earnings increased in YTD FY'27, but the improvement did not convert into pre-Ind AS 116 free cash flow because of working capital, the lease adjustment and higher capital expenditure. Revenue from operations rose 21% to Rs 2,041.8 crore from Rs 1,692.1 crore. Reported earnings before interest, tax, depreciation and amortisation, or EBITDA, increased 25% to Rs 246.7 crore, while the EBITDA margin rose to 12.1% from 11.7%.
On a pre-Ind AS 116 basis, EBITDA was Rs 89.1 crore in YTD FY'27, compared with Rs 65.7 crore in YTD FY'26, and the margin increased to 4.4% from 3.9%. Pre-Ind AS 116 profit after tax was Rs 21.7 crore, compared with Rs 0.7 crore a year earlier. The cash-flow presentation deducts the Rs 157.6 crore Ind AS 116 adjustment from reported operating cash flow before calculating free cash flow.
Reported profit before tax was Rs 38.8 crore, up from Rs 29.3 crore, and reported profit after tax rose to Rs 30.9 crore from Rs 24.7 crore. Cash and cash equivalents were Rs 13 crore at September 30, 2026, compared with Rs 19.5 crore at March 31, 2026. The net decrease in cash and cash equivalents during the period was Rs 6.6 crore, versus a Rs 15.6 crore decrease in the comparable prior-year period.
Got a follow-up? Ask IRIS
What changed in V-Mart's balance sheet during the festive build-up?
V-Mart increased inventory, borrowings and current liabilities between March 31 and September 30, 2026. Borrowings rose to Rs 190 crore from Rs 100 crore, while current liabilities increased to Rs 1,472 crore from Rs 1,196 crore. Current assets rose to Rs 1,485.9 crore from Rs 1,239.8 crore over the same period.
Payables, including trade payables, rose to Rs 599.4 crore from Rs 491 crore, while other financial liabilities increased to Rs 394.4 crore from Rs 335 crore. These balance-sheet changes occurred alongside management's disclosure of faster vendor payments, although the presentation does not isolate the cash effect of each liability category. Total equity rose to Rs 978.8 crore from Rs 951.1 crore.
Investment in the physical network is also reflected in non-current assets. Property, plant and equipment rose to Rs 615.6 crore from Rs 583.6 crore, while capital work-in-progress increased to Rs 12.6 crore from Rs 8.3 crore. Right-of-use assets increased to Rs 783.2 crore from Rs 750.2 crore as the store network reached 613 locations at September 30, 2026.
How does V-Mart's store expansion relate to cash requirements?
V-Mart added stores in Q2 FY'27 while preparing seasonal inventory, creating concurrent demands on stock and investment. It opened 23 stores and closed one store, resulting in a net addition of 22 stores. The network reached 613 stores across 351 cities and 5.2 million square feet at September 30, 2026, compared with 533 stores in Q2 FY'26.
The 23 openings included nine Tier 3 stores, eight Tier 2 stores and six Tier 1 stores, with no Tier 4 additions. Uttar Pradesh received seven new stores, while Bihar and Madhya Pradesh each received three. Management describes the rollout as cluster-based expansion in Tier 2 and Tier 3 catchments.
V-Mart had 229 stores in Tier I and II cities and 384 stores in Tier III and IV cities as of September 30, 2026. All stores served digital orders, according to the presentation. Management said its balance sheet supports ongoing network expansion and seasonal stock preparation, while net capital expenditure in YTD FY'27 was Rs 84.6 crore.
Conclusion
V-Mart's YTD FY'27 performance shows that higher earnings did not translate into pre-Ind AS 116 free cash flow. Revenue rose 21%, reported EBITDA increased 25%, and reported profit after tax reached Rs 30.9 crore, but a Rs 93.9 crore working-capital outflow, a Rs 157.6 crore Ind AS 116 adjustment and Rs 84.6 crore of net capital expenditure resulted in negative free cash flow of Rs 113.8 crore.
The next reporting periods will show whether the festive inventory converts into sales and whether the nine-day narrowing in the DPO-DOI gap persists. Investors can also track cash conversion alongside management's disclosed ongoing network expansion after Q2 FY'27 added 22 net stores and took V-Mart's network to 613 locations.