










V-Mart Retail Limited revenue up 21%, PAT margin holds 1.5%
Key highlights
- V-Mart’s YTD FY27 revenue rose 21% to Rs 2,041.8 crore.
- V-Mart’s reported YTD FY27 EBITDA increased 25% to Rs 246.7 crore and margin reached 12.1%.
- V-Mart’s YTD FY27 PAT rose 25% to Rs 30.9 crore, while PAT margin remained 1.5%.
- V-Mart’s inventories increased to Rs 1,190.4 crore at September 30, 2026 from Rs 987.5 crore at March 31, 2026.
powered by IRIS
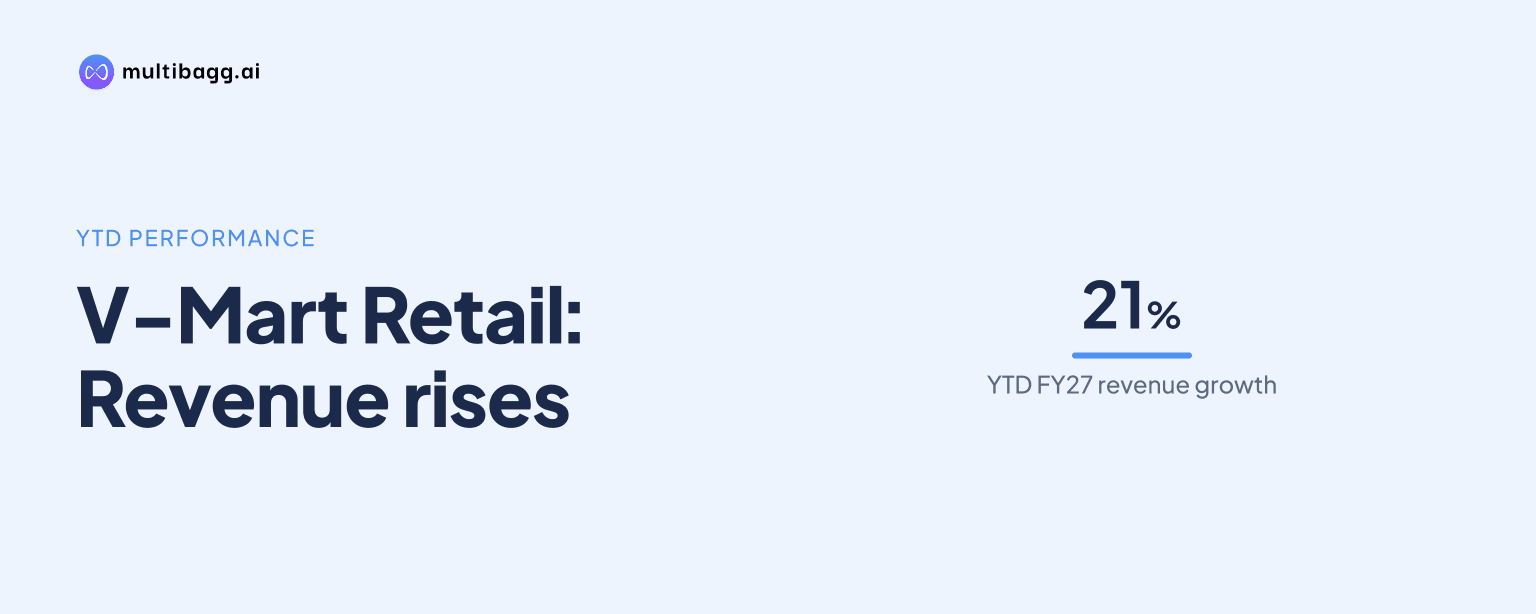
V-Mart Retail Limited reported YTD FY27 revenue of Rs 2,041.8 crore, up 21% year on year, and post-Ind AS 116 EBITDA of Rs 246.7 crore, up 25%, for the period ended September 30, 2026. Reported profit after tax, or PAT, rose 25% to Rs 30.9 crore, while PAT margin remained 1.5%.
Know V-Mart Retail inside out
Results, valuation, peers and who's buying, in one view.
Why did V-Mart’s first-half revenue and EBITDA increase?
V-Mart’s revenue from operations increased by Rs 349.7 crore to Rs 2,041.8 crore in YTD FY27 from Rs 1,692.1 crore in YTD FY26, while post-Ind AS 116 EBITDA rose by Rs 49 crore to Rs 246.7 crore from Rs 197.7 crore. EBITDA margin increased to 12.1% from 11.7%, a rise of 0.4 percentage points.
Gross profit increased 19% to Rs 694.1 crore from Rs 583.7 crore, but grew more slowly than revenue. Gross profit margin therefore declined to 34.0% from 34.5%, while cost of goods sold rose to Rs 1,347.7 crore from Rs 1,108.4 crore. Employee expenses increased to Rs 223.2 crore from Rs 192.6 crore and post-Ind AS 116 other expenses rose to Rs 224.2 crore from Rs 193.5 crore.
V-Mart also reported pre-Ind AS 116 EBITDA of Rs 89.1 crore in YTD FY27, compared with Rs 65.7 crore in YTD FY26, an increase of 36%. On that basis, EBITDA margin rose to 4.4% from 3.9%, while the post-Ind AS 116 presentation reflected lease-accounting adjustments within other expenses.
Why did V-Mart’s PAT margin remain at 1.5%?
V-Mart’s reported PAT margin remained at 1.5% because PAT rose 25% to Rs 30.9 crore from Rs 24.7 crore, broadly tracking the 21% increase in revenue at the disclosed one-decimal margin precision. Profit before tax, or PBT, increased 32% to Rs 38.8 crore from Rs 29.3 crore, and PBT margin rose to 1.9% from 1.7%.
Depreciation and amortisation increased to Rs 172.7 crore from Rs 139 crore, while finance cost rose to Rs 40.5 crore from Rs 35.7 crore. Other income declined to Rs 5.3 crore from Rs 6.4 crore, and tax increased to Rs 8 crore from Rs 4.6 crore. These items left the increase in PAT at Rs 6.2 crore despite the Rs 49 crore rise in post-Ind AS 116 EBITDA.
V-Mart’s pre-Ind AS 116 PAT was Rs 21.7 crore in YTD FY27, compared with Rs 70 lakh in YTD FY26. The stated pre-Ind AS 116 PAT margin was 1.1% in FY27 versus 0.0% in FY26, while the presentation identifies rent reversal, finance cost, depreciation and profit on termination of lease as components of the Ind AS 116 effect.
How did Ind AS 116 affect V-Mart’s first-half earnings?
V-Mart’s YTD FY27 Ind AS 116 reconciliation shows a Rs 157.6 crore reduction in other expenses, described as rent reversal, which increased EBITDA from Rs 89.1 crore before the standard to Rs 246.6 crore after it. The statement of profit and loss reports post-Ind AS 116 EBITDA of Rs 246.7 crore for the same YTD FY27 period.
The reconciliation shows that finance cost increased by Rs 28.7 crore to Rs 40.5 crore and depreciation increased by Rs 118.3 crore to Rs 172.7 crore under Ind AS 116. Other income increased by Rs 90 lakh, leaving PBT at Rs 38.8 crore after the standard compared with Rs 27.3 crore before it.
In YTD FY26, the reconciliation showed a Rs 131.9 crore rent reversal and EBITDA of Rs 197.6 crore after Ind AS 116, compared with Rs 65.7 crore before it. Finance cost increased by Rs 22.4 crore and depreciation by Rs 83.1 crore, while PBT increased from Rs 90 lakh before the standard to Rs 29.3 crore after it.
Got a follow-up? Ask IRIS
What does V-Mart’s Q2 result show about the first-half outcome?
V-Mart reported Q2 FY27 revenue of Rs 953 crore, up 18% from Rs 806.9 crore in Q2 FY26, and post-Ind AS 116 EBITDA of Rs 86.1 crore, up 20% from Rs 71.5 crore. EBITDA margin improved to 9.0% from 8.9%, but the quarter ended with a PAT loss of Rs 16.3 crore, compared with a loss of Rs 8.9 crore a year earlier.
Q2 FY27 gross profit margin edged down to 33.5% from 33.6%, while depreciation and amortisation reached Rs 88.8 crore and finance cost was Rs 20.7 crore. PBT was a loss of Rs 20.7 crore, compared with a loss of Rs 13.6 crore in Q2 FY26. The presentation states that quarterly PAT remained impacted by depreciation under Ind AS 116.
The YTD FY27 results nevertheless remained profitable, with PAT of Rs 30.9 crore after the Q2 loss. The YTD FY26 comparison also recorded a 1.5% reported PAT margin, even though YTD FY27 revenue was Rs 349.7 crore higher and EBITDA was Rs 49 crore higher.
How did V-Mart’s inventory and cash flow change in YTD FY27?
V-Mart’s inventories rose to Rs 1,190.4 crore at September 30, 2026, from Rs 987.5 crore at March 31, 2026. Pre-Ind AS 116 free cash flow was negative Rs 113.8 crore, compared with positive Rs 26.6 crore for the period ended September 30, 2025. Management attributed the negative free cash flow primarily to festive inventory build-up and faster vendor payments.
Net cash flow from operating activities declined to Rs 140.2 crore from Rs 232.7 crore, despite operating profit before working-capital changes increasing to Rs 249.2 crore from Rs 206.6 crore. Working-capital changes were an outflow of Rs 93.9 crore, against an inflow of Rs 29.1 crore a year earlier, while net capital expenditure rose to Rs 84.6 crore from Rs 60 crore.
Borrowings increased to Rs 190 crore at September 30, 2026, from Rs 100 crore at March 31, 2026. Current liabilities rose to Rs 1,472 crore from Rs 1,196 crore, including payables of Rs 599.4 crore compared with Rs 491 crore. Cash and cash equivalents declined to Rs 13 crore from Rs 19.5 crore over the same dates.
Conclusion
V-Mart delivered higher first-half revenue, EBITDA and PAT in YTD FY27, with post-Ind AS 116 EBITDA margin increasing to 12.1% from 11.7%. However, gross profit margin declined to 34.0% from 34.5%, and higher depreciation, finance cost and tax meant that the reported PAT margin remained at 1.5% despite PAT increasing to Rs 30.9 crore.
The next disclosed issue to watch is the effect of festive inventory build-up and faster vendor payments on working capital, after inventories reached Rs 1,190.4 crore and pre-Ind AS 116 free cash flow was negative Rs 113.8 crore at September 30, 2026. V-Mart also said its balance sheet supports ongoing network expansion and seasonal stock preparation, while borrowings stood at Rs 190 crore on that date.