










Vikram Solar Q2 EBITDA falls 57% as margin reaches 9.4%
Key highlights
- Vikram Solar reported Q2 FY27 EBITDA of Rs 101 crore, down 56.9% year on year.
- Vikram Solar’s Q2 FY27 EBITDA margin declined to 9.4% from 21.2% in Q2 FY26.
- Vikram Solar’s Q2 FY27 sales volume fell 24.6% year on year to 591 MW.
- Vikram Solar’s order book reached 8.2 GW at 30 September 2026 after about 1.7 GW of Q2 additions.
powered by IRIS
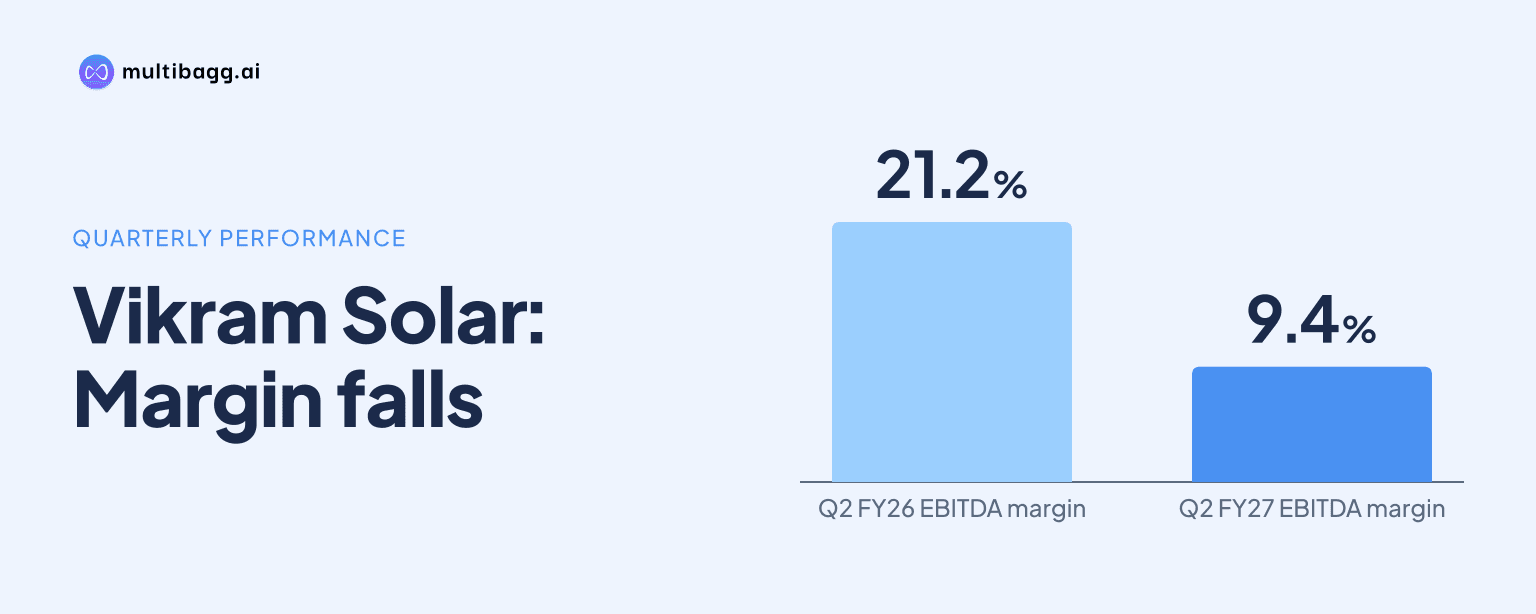
Vikram Solar Limited reported EBITDA of Rs 101 crore for Q2 FY27, down 56.9% year on year, while its EBITDA margin fell to 9.4% from 21.2%, rather than disclosing a 95% net-profit decline. Sales volume declined 24.6% to 591 MW, and Vikram Solar cited execution delays, bought-in cell costs and non-DCR pricing.
Know Vikram Solar inside out
Results, valuation, peers and who's buying, in one view.
Did Vikram Solar report a 95% Q2 profit decline?
The supplied presentation does not report net profit or a 95% profit decline for Vikram Solar; it reports earnings before interest, tax, depreciation and amortisation, or EBITDA, of Rs 101 crore in Q2 FY27. That was down 56.9% from Rs 235 crore in Q2 FY26, while EBITDA margin declined by 11.78 percentage points to 9.4% from 21.2% for the quarter ended 30 September 2026.
The fall in EBITDA was substantially larger than the revenue movement. Revenue from operations declined 2.9% year on year to Rs 1,077 crore from Rs 1,110 crore, while EBITDA declined by Rs 134 crore. On a sequential basis, EBITDA was 19.7% below Rs 126 crore in Q1 FY27, despite EBITDA per watt-peak, or Wp, increasing 36.6% to Rs 1.71 from Rs 1.25.
The sequential increase in EBITDA per Wp did not prevent total EBITDA from declining because invoiced volume dropped 41.2% quarter on quarter. Vikram Solar’s presentation describes Q2 FY27 as a transition quarter ahead of manufacturing integration, with the company still making modules using bought-in cells.
How much did Vikram Solar’s volume and revenue decline?
Vikram Solar sold 591 megawatts, or MW, in Q2 FY27, down 24.6% from 784 MW in Q2 FY26 and down 41.2% from 1,006 MW in Q1 FY27. Revenue fell more sharply sequentially, decreasing 31.1% to Rs 1,077 crore from Rs 1,563 crore in Q1 FY27, while the year-on-year revenue decline was 2.9%.
Vikram Solar attributed the sequential volume decline to monsoon conditions and deferred execution, stating that India installations fell 25%. The preceding quarterly trend shows volume of 999 MW in Q4 FY26 and 1,006 MW in Q1 FY27 before Q2 FY27 fell to 591 MW; revenue followed from Rs 1,453 crore in Q4 FY26 to Rs 1,563 crore and then Rs 1,077 crore.
The half-year comparison was more favourable for sales than the individual quarter. H1 FY27 volume rose 3.1% to 1,596 MW from 1,548 MW in H1 FY26, and revenue increased 17.7% to Rs 2,641 crore from Rs 2,243 crore. However, H1 EBITDA fell to Rs 227 crore from Rs 477 crore, and the margin declined to 8.6% from 21.3%.
That contrast indicates that the Q2 slowdown arrived after a larger first-quarter sales base, rather than erasing the half-year increase in revenue. The presentation gives no net-profit figure for either Q2 FY27 or H1 FY27, so the disclosed profitability comparison is limited to EBITDA and EBITDA margin.
What caused Vikram Solar’s Q2 margin compression?
Vikram Solar attributed Q2 FY27 margin pressure to bought-in cell costs, competitive pricing in non-domestic content requirement, or non-DCR, modules, and lower seasonal volume. These factors coincided with a 9.4% EBITDA margin in Q2 FY27, compared with 21.2% a year earlier, even though EBITDA per Wp increased sequentially to Rs 1.71.
The company had 15.5 gigawatts, or GW, of Approved List of Models and Manufacturers, or ALMM-listed, module capacity operating with bought-in cells. Vikram Solar said the first output from its tunnel oxide passivated contact, or TOPCon, cell line remained on track for December 2026, followed by production at a 9 GW TOPCon cell plant in March 2027.
The Q2 product mix shifted towards DCR modules, which are modules meeting domestic content requirement rules. DCR volume rose 71% quarter on quarter to 130 MW from 76 MW, lifting its share of invoiced volume to 22.0% from 7.5%. Non-DCR modules still represented 78.0% of Q2 FY27 volume, within the product category where Vikram Solar identified competitive pricing pressure.
Distribution also gained share as total volume contracted. Distribution volume rose about 80% quarter on quarter to 259 MW from 145 MW, and its share of invoiced volume increased to 44% from 14%. Vikram Solar says distribution earns higher realisation than its other sales channels and has shorter cash cycles, but the presentation does not quantify distribution-specific revenue or margins.
Got a follow-up? Ask IRIS
Which sales channels and orders supported Vikram Solar?
Vikram Solar’s distribution and commercial and industrial, or C&I, channels increased their shares of Q2 FY27 invoiced volume, while engineering, procurement and construction, or EPC, and independent power producer, or IPP, shares declined. Distribution rose to 44% from 14%, C&I moved to 37% from 36%, EPC fell to 17% from 31%, and IPP dropped to 1% from 11%.
These percentage changes took place while overall invoiced volume fell by 415 MW sequentially to 591 MW from 1,006 MW. Government sales represented 1% of Q2 FY27 volume compared with 8% in Q1 FY27. As a result, a higher channel share does not by itself establish that each channel’s absolute shipments increased.
Vikram Solar reported 133 distributors at the end of Q2 FY27, up 12% quarter on quarter, and more than 750 dealers and system integrators across more than 500 districts in 22 states and two union territories. It linked distribution demand to PM Surya Ghar, which it said had reached 56 lakh installations equivalent to about 19.6 GW, and to activity under PM KUSUM.
Order intake increased separately from Q2 invoicing. Vikram Solar added about 1.7 GW of orders during Q2 FY27, 113% more than in Q1 FY27, taking the order book to 8.2 GW at 30 September 2026 from 7.9 GW at 30 June 2026. The Q2 order-book calculation removed about 1 GW of exports in relation to US Section 232 minimum import price rules.
What milestones could change Vikram Solar’s cost base?
Vikram Solar plans first cell output in December 2026, production at its 9 GW TOPCon cell plant in March 2027, and commercial operations at a 7.5 gigawatt-hour, or GWh, battery energy storage system, or BESS, assembly plant in April 2027. The company presents these steps as its route from bought-in-cell module manufacturing towards a more integrated supply chain.
The longer-term plan includes a 9 GW ingot-wafer plant in FY29, intended to complete an ingot-to-module chain for ALMM List-III, with ingot and module operations co-located. Vikram Solar also plans to scale BESS capacity to 15 GWh through VSL PowerHive in FY30. The presentation does not provide a target EBITDA margin or a quantified financial benefit from these projects.
Nearer term, Vikram Solar said it had secured 1 GW of DCR TOPCon cells. That supply is relevant to a quarter in which DCR module volume was 130 MW and accounted for 22.0% of invoiced volume, while the company’s own cell line was not expected to produce its first cells until December 2026.
The disclosed schedule leaves execution and the timing of order conversion as key unresolved matters. The presentation identifies the cell plant, BESS assembly plant and ingot-wafer project as manufacturing milestones, but does not disclose project spending, funding sources, utilisation assumptions or segment-level profit targets.
Conclusion
Vikram Solar’s Q2 FY27 figures show that revenue was comparatively resilient while earnings contracted sharply: revenue declined 2.9% year on year to Rs 1,077 crore, but EBITDA fell 56.9% to Rs 101 crore and margin dropped to 9.4%. Higher DCR and distribution contributions lifted EBITDA per Wp to Rs 1.71 sequentially, yet lower total volume limited the effect on quarterly EBITDA.
The next disclosed milestones are first TOPCon cell output in December 2026, 9 GW of cell-plant production in March 2027 and commercial operations at the 7.5 GWh BESS plant in April 2027. Vikram Solar’s 8.2 GW order book, the recovery of sales volume from 591 MW, and the persistence of the 44% distribution share are the operating measures to watch alongside those dates.