










Zaggle revenue grew 51% CAGR as gross margin narrowed in FY26
Key highlights
- Zaggle reported FY26 revenue from operations of Rs 1,907.65 crore, up 46.3% year on year.
- Zaggle reported a 51.1% revenue CAGR between FY23 and FY26.
- Zaggle’s gross profit margin declined to 44.9% in FY26 from 50.9% in FY24.
- Zaggle’s FY26 adjusted EBITDA was Rs 194 crore, up 57.3% year on year.
powered by IRIS
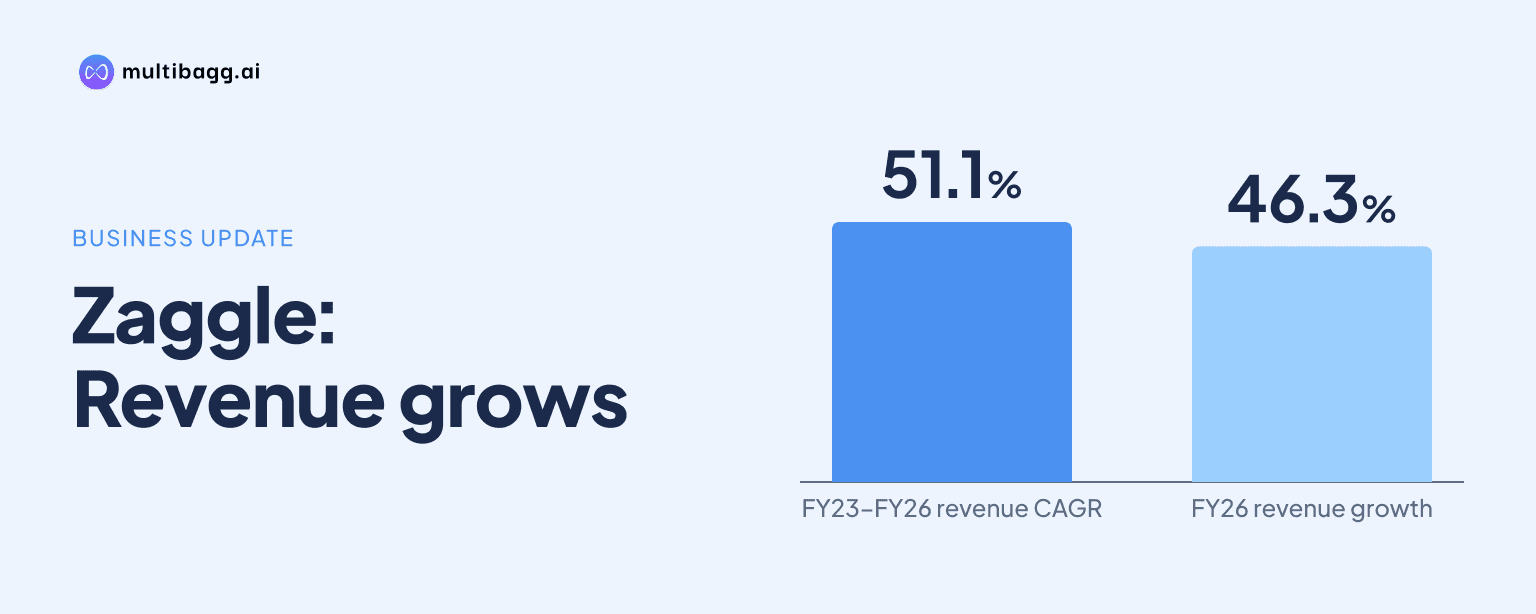
Zaggle reported revenue from operations of Rs 1,907.65 crore in FY26, completing a reported 51.1% compound annual growth rate from FY23, while gross profit margin narrowed to 44.9% from 50.9% in FY24. Adjusted earnings before interest, tax, depreciation and amortisation reached Rs 194 crore in FY26.
Know Zaggle Prepaid Ocean Services inside out
Results, valuation, peers and who's buying, in one view.
How fast did Zaggle’s revenue and user base grow?
Zaggle’s revenue from operations rose from Rs 553.46 crore in FY23 to Rs 1,907.65 crore in FY26, a 51.1% compound annual growth rate, or CAGR, over the period. FY26 revenue was 46.3% above Rs 1,303.76 crore in FY25, after revenue increased from Rs 775.60 crore in FY24 to Rs 1,303.76 crore in FY25.
The absolute annual revenue addition increased over the reported period. Revenue rose by Rs 222.14 crore in FY24, Rs 528.16 crore in FY25 and Rs 603.89 crore in FY26, making FY26 the largest annual increase in rupee terms even though its 46.3% growth rate was below the preceding year’s percentage increase.
Zaggle had 3,915 corporate customers in FY2026, compared with 3,455 in FY2025 and 2,411 in FY2023, a reported CAGR of 17.5%. Aggregate users rose to 3.90 million from 3.28 million in FY2025 and 2.27 million in FY2023, representing a reported 19.8% CAGR; the company defines this measure as employees, channel partners and customers of its customers served by the company.
Why did Zaggle’s gross profit margin narrow in FY26?
Zaggle’s gross profit margin was 44.9% in FY26, down 3.0 percentage points from 47.9% in FY25 and 6.0 percentage points from the FY24 level of 50.9%. The FY24 margin is the basis for describing the margin as narrowing from about 51% to about 45%; FY23 margin was lower, at 42.1%.
Gross profit still increased in rupee terms in each reported year, reaching Rs 855.67 crore in FY26 from Rs 623.96 crore in FY25 and Rs 232.84 crore in FY23. The rise in gross profit therefore accompanied lower gross-margin percentages after FY24, as revenue expanded faster than the gross profit retained from that revenue.
The cost of point redemption and gift cards was Rs 1,050.47 crore in FY26, up from Rs 678.10 crore in FY25 and Rs 318.87 crore in FY23. Consumption of cards was Rs 1.51 crore in FY26, compared with Rs 1.70 crore in FY25, and these two lines are deducted from revenue in arriving at the reported gross profit.
Got a follow-up? Ask IRIS
Did Zaggle’s operating and net profit rise with revenue?
Zaggle’s adjusted EBITDA increased to Rs 194 crore in FY26 from Rs 123.36 crore in FY25, a 57.3% year-on-year increase that exceeded revenue growth of 46.3%. Adjusted EBITDA recorded a reported 45.9% CAGR from Rs 62.51 crore in FY23, while its margin recovered to 10.2% in FY26 from 9.5% in FY25.
The FY26 adjusted EBITDA margin remained below 11.0% in FY24 and 11.3% in FY23. Employee benefits expense rose to Rs 68.20 crore from Rs 57.48 crore in FY25, incentive and cash-back expense increased to Rs 505.26 crore from Rs 359.87 crore, and other expenses reached Rs 95.03 crore from Rs 83.33 crore; the statement also reported Rs 6.82 crore of Mobileware EBITDA in FY26.
Profit after tax, or PAT, rose to Rs 138.75 crore in FY26 from Rs 87.90 crore in FY25 and Rs 22.91 crore in FY23. PAT margin reached 7.3%, compared with 6.7% in FY25, 5.7% in FY24 and 4.1% in FY23, moving upward across the four reported years despite the decline in gross margin after FY24.
Finance cost declined to Rs 5.33 crore in FY26 from Rs 7.66 crore in FY25 and Rs 13.72 crore in FY24. Other income was Rs 38 crore in FY26 against Rs 26.77 crore in FY25, while depreciation and amortisation increased to Rs 36.88 crore from Rs 14.79 crore; basic earnings per share rose to Rs 10.33 from Rs 6.99.
What changed in Zaggle’s cash profit and balance sheet?
Zaggle reported cash PAT of Rs 177.86 crore in FY26, up from Rs 111.95 crore in FY25 and Rs 43.55 crore in FY23. The company defines cash PAT as PAT plus depreciation and amortisation plus employee stock option plan cost, and its cash PAT margin was 9.3% in FY26 versus 8.6% in FY25.
Total assets stood at Rs 1,553.65 crore at March 2026, compared with Rs 1,315.04 crore at March 2025. Total equity was Rs 1,406.80 crore at March 2026, while total liabilities were Rs 146.86 crore, including Rs 138.42 crore of current liabilities and Rs 8.43 crore of non-current liabilities.
Non-current borrowings were nil at March 2026, compared with Rs 3.45 crore a year earlier. Current borrowings, however, increased to Rs 45.40 crore from Rs 5.09 crore, while trade receivables rose to Rs 361.18 crore from Rs 215.17 crore and cash and cash equivalents increased to Rs 105.98 crore from Rs 38.18 crore.
Conclusion
Zaggle’s FY23-FY26 record shows rapid expansion in revenue, corporate customers and aggregate users, alongside higher gross profit, adjusted EBITDA and PAT in rupee terms. The main qualification is the gross-margin path: it rose from 42.1% in FY23 to 50.9% in FY24, then declined to 47.9% in FY25 and 44.9% in FY26 as point-redemption and gift-card costs increased.
The presentation does not disclose a future revenue or margin target. Subsequent reporting will show whether the FY26 adjusted EBITDA margin of 10.2% can remain above FY25’s 9.5% level, whether gross margin changes from 44.9%, and how customer numbers build from 3,915 corporate customers and 3.90 million aggregate users.