










Zodiac Energy revenue rose 147% by FY26, margins widened
Key highlights
- Zodiac Energy’s revenue from operations increased from Rs 220 crore in FY24 to Rs 544 crore in FY26.
- Zodiac Energy’s operating margin rose from 8.6% in FY24 to 10.3% in FY26.
- Zodiac Energy’s inventory days increased to 77 in FY26 from 35 in FY25.
- Zodiac Energy’s RoE declined to 19.6% in FY26 from 27.7% in FY25.
powered by IRIS
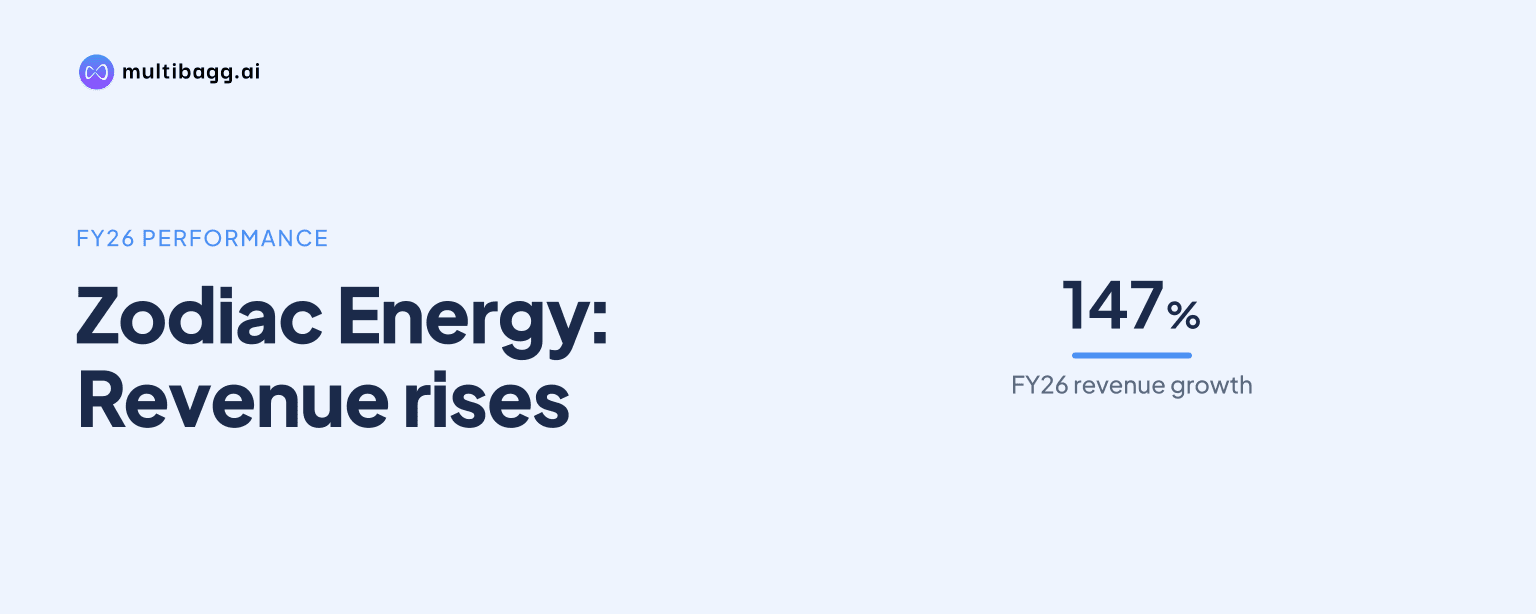
Zodiac Energy increased revenue from operations by 147% to Rs 544 crore in financial year (FY) 2026 from Rs 220 crore in FY24, while its operating margin rose to 10.3% from 8.6%. The higher scale coincided with lower returns on equity and capital employed, and net debt-to-equity of 2.1 in FY26.
Know Zodiac Energy inside out
Results, valuation, peers and who's buying, in one view.
How did Zodiac Energy’s revenue and profit change from FY24 to FY26?
Zodiac Energy’s revenue from operations rose by Rs 324 crore over FY24-FY26, reaching Rs 544 crore in FY26 from Rs 220 crore in FY24. Revenue was Rs 408 crore in FY25, so the year-on-year increase moderated to Rs 136 crore in FY26 from Rs 188 crore in FY25. Operating profit, reported as earnings before interest, depreciation, tax and amortisation (EBIDTA), increased from Rs 19 crore in FY24 to Rs 56 crore in FY26.
Profit after tax (PAT) increased by Rs 1 crore to Rs 21 crore in FY26 from Rs 20 crore in FY25, following a Rs 9 crore increase in FY25 from FY24. The detailed income statement reports FY26 EBIDTA of Rs 55.8 crore, up 51% from Rs 37 crore, while finance costs rose 122% to Rs 19.3 crore and depreciation rose 270% to Rs 10 crore.
Did Zodiac Energy’s margins improve as revenue expanded?
Zodiac Energy’s gross margin rose by 5 percentage points to 21.3% in FY26 from 16.3% in FY24, while operating margin increased by 1.7 percentage points to 10.3% from 8.6%. Operating margin moved from 8.6% in FY24 to 9.1% in FY25 and 10.3% in FY26. The detailed statement describes the FY25-FY26 increase as 118 basis points, with one basis point equal to one-hundredth of a percentage point.
The operating-margin increase did not extend to PAT margin, which declined to 3.9% in FY26 from 4.9% in FY25 and 5.0% in FY24. Materials costs, including changes in inventories, were Rs 427.7 crore in FY26 versus Rs 337.8 crore in FY25, while total operating expenses rose to Rs 47.4 crore from Rs 23.6 crore. Those costs were reported alongside higher finance costs and depreciation in FY26.
What changed in Zodiac Energy’s cash conversion cycle?
Zodiac Energy’s cash conversion cycle was 94 days in FY26, lower than 118 days in FY24 but above 63 days in FY25. Inventory days increased to 77 in FY26 from 35 in FY25 and 31 in FY24. Debtor days, in contrast, decreased to 57 in FY26 from 61 in FY25 and 106 in FY24.
The FY26 balance sheet recorded inventories of Rs 128.5 crore, up from Rs 51.5 crore in FY25, and trade receivables of Rs 113.1 crore, up from Rs 57.1 crore. By H1 FY27, inventories had declined to Rs 70.5 crore and trade receivables to Rs 54.2 crore. The presentation does not report a cash conversion cycle or inventory-day figure for H1 FY27.
Got a follow-up? Ask IRIS
Why did Zodiac Energy’s returns and leverage change in FY26?
Zodiac Energy’s return on equity (RoE) declined to 19.6% in FY26 from 27.7% in FY25 and 26.2% in FY24. Return on capital employed (RoCE) decreased in each reported year, falling to 20.0% in FY26 from 25.6% in FY25 and 33.8% in FY24. These declines occurred as FY26 revenue increased by Rs 136 crore and operating profit increased by Rs 19 crore from FY25.
Zodiac Energy reported net debt-to-equity of 2.1 in FY26, down from 2.4 in FY25 but above 0.9 in FY24. Current and non-current borrowings totalled Rs 229 crore in FY26, comprising Rs 121.9 crore of current borrowings and Rs 107.1 crore of non-current borrowings, versus Rs 157.5 crore in FY25. At H1 FY27, the two borrowing categories totalled Rs 190 crore, while equity capital was Rs 135 crore compared with Rs 118.7 crore at FY26.
How did Zodiac Energy’s solar business mix develop?
Zodiac Energy’s ground-mounted solar business remained its largest disclosed line, generating Rs 352 crore in FY26, or 65% of consolidated revenue, compared with Rs 144.1 crore and 65% in FY24. Ground-mounted revenue increased by Rs 62.8 crore from Rs 289.2 crore in FY25, although its client count declined to 27 from 59. The company says it is selectively addressing customers that value quality, assurance and service over low-cost offerings.
Zodiac Energy’s rooftop solar revenue was Rs 22 crore in FY26, up from Rs 15.8 crore in FY25, but it represented 4% of consolidated revenue in both years. Rooftop client numbers decreased to 565 in FY26 from 1,118 in FY25 and 1,142 in FY24. In Q2 FY27, rooftop revenue was Rs 25.5 crore, or 15% of consolidated revenue, compared with Rs 4.1 crore and 4% in Q2 FY26.
Conclusion
Zodiac Energy’s FY24-FY26 performance combined materially higher revenue with wider gross and operating margins. Revenue increased by Rs 324 crore, operating profit increased by Rs 37 crore and gross margin rose by 5 percentage points. However, PAT increased by Rs 10 crore across the two years, while RoE declined by 6.6 percentage points from FY24 and RoCE declined by 13.8 percentage points.
The next disclosed data point to watch is whether the FY26 working-capital movement continues to reverse in H1 FY27 and later periods. Inventories declined to Rs 70.5 crore in H1 FY27 from Rs 128.5 crore at FY26, while Q2 FY27 operating margin was 11.6%, versus 10.6% in Q2 FY26. The presentation does not provide a target or schedule for cash conversion, returns or leverage.