


Investor Presentation
Himalaya Nutravedics India H1 FY27 Investor Presentation
Himalaya Nutravedics India released its investor presentation for H1 FY27, reporting revenue growth of 35.8% and EBITDA growth of 51.1% year-on-year.





IRIS
Multibagg AI is an AI powered stock research and analysis platform. We provide data, information, content, and analytics for publicly traded Indian companies listed on NSE and BSE. AI can make mistakes, check important information.
Prices might be delayed by a few minutes.
Join our Exclusive Community


Join our Exclusive Community
Made with 💙 in India. © Finsky Technologies Pvt Ltd. 2026


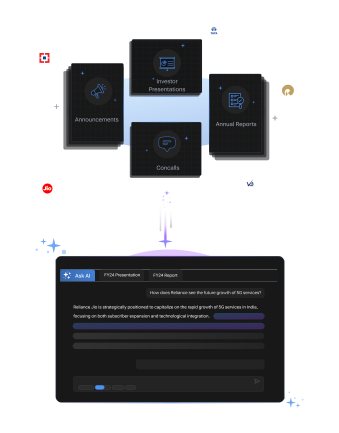
Get instant AI-powered insights about company performance, financials, and strategy. Ask questions about trends, competition, and developments while receiving responses backed by official documents and market data, with clear attribution to source documents.




 Discovery themes featuring this stock
Bearish
4
Neutral
6
Bullish
4
Bearish
4
Neutral
22
Bullish
20
Bearish
0
Neutral
16
Bullish
16
Bearish
0
Neutral
16
Bullish
16
Bearish
0
Neutral
16
Bullish
16
Bearish
0
Neutral
16
Bullish
16



Investor Presentation
Q2 FY27



Himalaya Nutravedics India Limited manufactures, markets and distributes classical and proprietary Ayurvedic formulations, nutraceuticals, and third-party contract-manufactured products across multiple dosage forms from its Hyderabad facility.
H1 FY27 revenue increased 35.8% year-on-year to ₹2,739.8 lakhs, while EBITDA grew 51.1% to ₹567.2 lakhs. EBITDA margin expanded 210 basis points to 20.7%, indicating improved operating leverage despite a single-facility manufacturing footprint.
Own-branded products became the larger revenue contributor at 54.7% in H1 FY27, marking a significant transition from the company’s earlier dependence on third-party manufacturing and potentially improving control over customer relationships, pricing, and long-term brand economics.
The company’s distribution network now covers 20 states and one Union Territory, although Kerala remains a major anchor market contributing 47.7% of H1 FY27 revenue. Geographic diversification is progressing, but regional concentration remains material.
IPO proceeds are intended to support ₹750 lakh of branding and digital marketing, working capital, D2C, marketplace, and quick-commerce initiatives. However, operating cash flow remained negative at ₹65.5 lakhs, while inventories and receivables continued rising, requiring close execution and liquidity monitoring.
Pharmaceuticals & Biotechnology
Pharmaceuticals
151 Cr
High Risk
18.1
39.5
—
3.5
188.95
109.95
Sales CAGR
Profit CAGR
ROE
ROCE

Himalaya Nutravedics India Ltd is currently trading at 173.00 per share. Stock prices fluctuate during market hours on NSE and BSE based on demand, company updates, and overall market conditions. Refer to the live price chart above for the most recent price movement.
Himalaya Nutravedics India Limited manufactures, markets and distributes classical and proprietary Ayurvedic formulations, nutraceuticals, and third-party contract-manufactured products across multiple dosage forms from its Hyderabad facility. H1 FY27 revenue increased 35.8% year-on-year to ₹2,739.8 lakhs, while EBITDA grew 51.1% to ₹567.2 lakhs. EBITDA margin expanded 210 basis points to 20.7%, indicating improved operating leverage despite a single-facility manufacturing footprint. Own-branded products became the larger revenue contributor at 54.7% in H1 FY27, marking a significant transition from the company’s earlier dependence on third-party manufacturing and potentially improving control over customer relationships, pricing, and long-term brand economics. The company’s distribution network now covers 20 states and one Union Territory, although Kerala remains a major anchor market contributing 47.7% of H1 FY27 revenue. Geographic diversification is progressing, but regional concentration remains material. IPO proceeds are intended to support ₹750 lakh of branding and digital marketing, working capital, D2C, marketplace, and quick-commerce initiatives. However, operating cash flow remained negative at ₹65.5 lakhs, while inventories and receivables continued rising, requiring close execution and liquidity monitoring.
Over the past 52 weeks, Himalaya Nutravedics India Ltd has traded between a low of ₹109.95 and a high of ₹188.95. The 52-week high and low indicate the stock’s price range over the last year and help investors understand its volatility and recent trading levels.
Himalaya Nutravedics India Ltd has a market capitalization of approximately 151.47. Market capitalization represents the total value of a company’s outstanding shares and helps investors understand its size, stability, and relative risk compared to other listed companies.
Himalaya Nutravedics India Ltd’s investment profile depends on its business fundamentals, valuation, and long-term outlook. The stock currently trades at a PE ratio of 18.08 and operates in the its sector sector. Investors typically assess financial performance, growth prospects, and individual risk tolerance before making investment decisions.
Based on its market capitalization of 151.47 Cr, Himalaya Nutravedics India Ltd is classified as a Small Cap stock. Large-cap stocks are generally more stable, while mid-cap and small-cap stocks tend to offer higher growth potential along with higher price volatility.
Himalaya Nutravedics India Ltd operates in the its sector sector. Sector classification matters because companies in the same sector are often affected by similar economic conditions, regulatory changes, and competitive dynamics, which can influence overall stock performance.
The Price-to-Earnings (PE) ratio of Himalaya Nutravedics India Ltd is 18.08. The PE ratio compares a company’s share price to its earnings and is commonly used to assess valuation. Comparing the PE ratio with sector peers and historical levels provides better context.
Himalaya Nutravedics reported Rs 25.84 crore of net cash from financing activities in H1 FY27, lifting cash and cash equivalents to Rs 26.62 crore. Its presentation also states that an IPO-led equity capital infusion increased the capital base during the period.
Himalaya Nutravedics generated 54.7% of H1 FY27 revenue from its own-brand business. Third-party contract manufacturing contributed the remaining 45.3%, making own brands the larger of its two reported segments.
Himalaya Nutravedics India reported net profit of ₹4.4 crore for the half year ended September 30, 2026. The company said this represented year-on-year growth of 33.3%.
| Symbol | Watchlist | Price | Market Cap | P/E | P/B | Div Yield (%) | ROE (%) | ROCE (%) | ROA (%) |
18.45 | 157 Cr | 11.50 | 1.95 | 0.00 | 16.97 | 18.56 | 6.75 | ||
91.00 | 152 Cr | 10.14 | 1.57 | 0.00 | 15.04 | 17.84 | 9.41 | ||
32.50 | 151 Cr | 20.97 | 8.51 | 0.00 | 41.95 | 22.81 | 6.97 | ||
169.40 | 149 Cr | 8.75 | 2.10 | 0.00 | 21.31 | 21.89 | 17.45 | ||
119.00 | 146 Cr | 11.21 | 1.22 | 0.00 | 10.89 | 14.45 | 9.36 | ||
234.50 | 145 Cr | 30.90 | 3.37 | 0.00 | 4.47 | 7.31 | 1.55 | ||
| Median: 6 Co. | — | 105.00 | 150 Cr | 11.36 | 2.02 | 0.00 | 16.00 | 18.20 | 8.17 |
Investor Presentation
Himalaya Nutravedics India released its investor presentation for H1 FY27, reporting revenue growth of 35.8% and EBITDA growth of 51.1% year-on-year.
Regulatory/Compliance Filing
Himalaya Nutravedics India Limited disclosed the KMPs authorized to assess materiality and report material events under SEBI Regulation 30(5).
Regulatory/Compliance Filing
Himalaya Nutravedics appointed M/s. Srinivasachary & Co. as internal auditor for FY 2026-27 on November 12, 2026.
Regulatory/Compliance Filing
Himalaya Nutravedics India Limited reported no deviation or variation in the use of ₹26.50 crore raised through its IPO for the half year ended September 30, 2026.
Regulatory/Compliance Filing
Himalaya Nutravedics India submitted Brickwork Ratings’ monitoring agency report for the quarter ended September 30, 2026, reporting no deviation in the use of IPO proceeds.
Financial Results
Himalaya Nutravedics India approved unaudited standalone financial results for the six months ended September 30, 2026, and appointed Srinivasachary & Co. as internal auditor for FY 2026-27.