










Himalaya Nutravedics cash hit Rs 26.62 crore, operating flow negative
Key highlights
- Himalaya Nutravedics ended H1 FY27 with Rs 26.62 crore in cash and cash equivalents, up from Rs 1.45 crore at FY26-end.
- Himalaya Nutravedics reported a Rs 65.5 lakh operating cash outflow in H1 FY27, after a Rs 3.84 crore outflow in FY26.
- Inventories and trade receivables totalled Rs 25.49 crore in H1 FY27, up from Rs 19.50 crore at FY26-end.
- Himalaya Nutravedics’ debt-to-equity ratio declined to 0.1 times in H1 FY27 from 0.3 times in FY26.
powered by IRIS
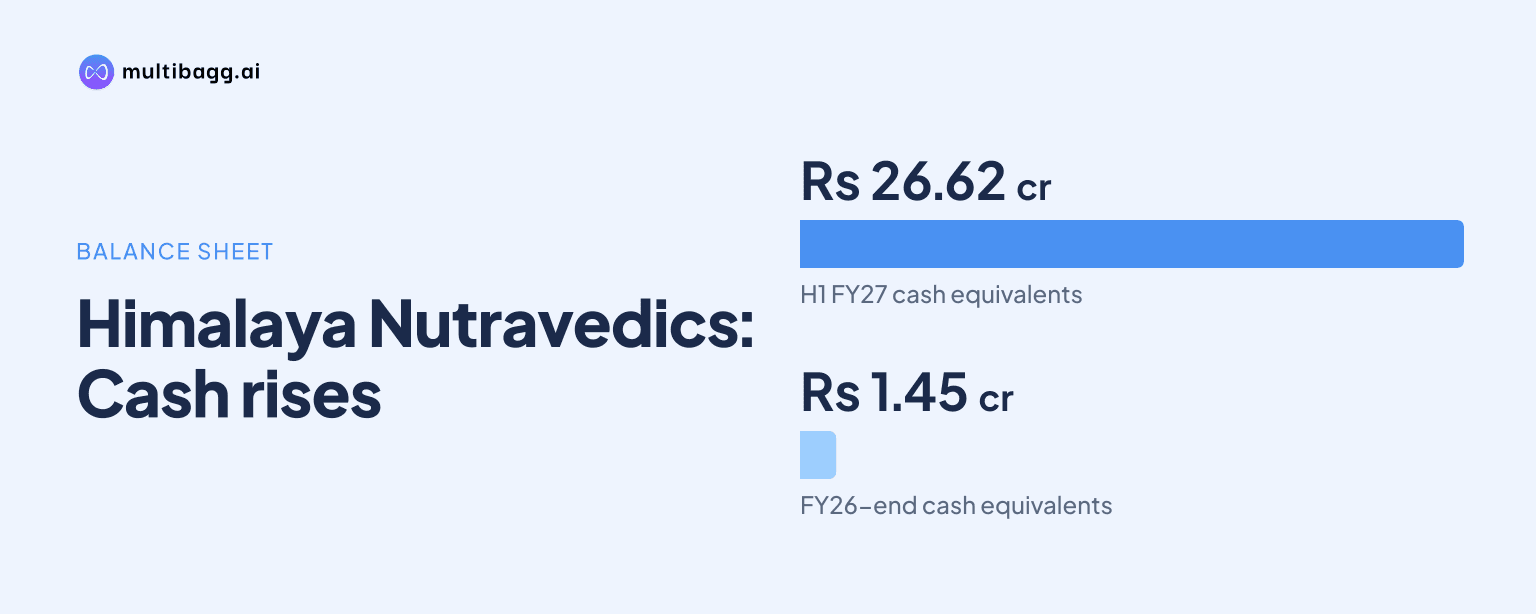
In H1 FY27, Himalaya Nutravedics India Limited ended with Rs 26.62 crore in cash and cash equivalents after financing activities generated Rs 25.84 crore, while operations used Rs 65.5 lakh. The presentation says an IPO-led equity infusion increased the capital base, even as inventory and receivables rose from FY26 levels.
Know Himalaya Nutravedics India inside out
Results, valuation, peers and who's buying, in one view.
How did the IPO-led infusion change Himalaya Nutravedics’ cash position?
Himalaya Nutravedics’ cash balance rose to Rs 26.62 crore at the end of H1 FY27 from Rs 1.45 crore at FY26-end, a Rs 25.17 crore increase during the half year. Net cash from financing activities was Rs 25.84 crore in H1 FY27, compared with Rs 5.28 crore in FY26, making financing the reported source of the cash increase rather than operating activity.
The presentation does not separately quantify IPO proceeds within financing cash flow. However, its note on return metrics states that an IPO-led equity capital infusion increased the capital base in H1 FY27. Shareholders’ funds rose to Rs 47.32 crore from Rs 16.38 crore at FY26-end, while total assets increased to Rs 57.80 crore from Rs 24.42 crore.
This funding-led balance-sheet change lifted the current ratio to 5.6 times in H1 FY27 from 2.7 times in FY26. Net worth, as separately presented in the historical-performance table, rose to Rs 47.32 crore in H1 FY27 from Rs 6.75 crore in FY25 and Rs 1.34 crore in FY24, showing the scale of the higher capital base across the reported periods.
Why was Himalaya Nutravedics’ operating cash flow negative in H1 FY27?
Himalaya Nutravedics used Rs 65.5 lakh in operating activities in H1 FY27 despite reporting profit after tax of Rs 4.44 crore. The difference shows that reported profit did not convert into positive operating cash flow during the half year, while the balance sheet carried higher inventory and trade-receivable balances than at FY26-end.
Operating cash flow was negative in every period shown in the presentation. Cash used in operations was Rs 3.84 crore in FY26, Rs 1.39 crore in FY25 and Rs 55.1 lakh in FY24; the H1 FY27 outflow was smaller than the FY26 outflow but remained negative. In contrast, H1 FY27 revenue from operations increased 35.8% year on year to Rs 27.40 crore, while EBITDA, or earnings before interest, tax, depreciation and amortisation, rose 51.1% to Rs 5.67 crore.
The cash-flow statement also records Rs 1.7 lakh used in investing activities in H1 FY27, compared with Rs 5.8 lakh in FY26. Investing was therefore a relatively small use of cash in the latest half year, while financing more than offset operating and investing outflows to produce a Rs 25.17 crore net increase in cash.
Got a follow-up? Ask IRIS
How much working capital is tied up in inventory and receivables?
Himalaya Nutravedics held Rs 13.22 crore of inventories and Rs 12.27 crore of trade receivables in H1 FY27, together amounting to Rs 25.49 crore. Inventory rose from Rs 8.92 crore at FY26-end and receivables rose from Rs 10.59 crore, resulting in a combined increase of Rs 5.21 crore during H1 FY27.
Inventory increased over the longer periods presented, reaching Rs 13.22 crore in H1 FY27 from Rs 3.28 crore in FY25 and Rs 2.52 crore in FY24. The strategic plan says Himalaya Nutravedics intends to expand ready finished-goods inventory across therapeutic categories to prevent stockouts, identifying continuing inventory requirements as part of the disclosed plan.
Trade receivables rose from Rs 5.64 crore in FY25 to Rs 10.59 crore in FY26 and then Rs 12.27 crore in H1 FY27. Debtor days declined modestly to 89.0 days in H1 FY27 from 89.7 days in FY26, after increasing from 39.3 days in FY24 to 98.0 days in FY25. The days measure improved slightly from FY26, although the absolute receivables balance increased alongside revenue.
Has Himalaya Nutravedics reduced borrowing as equity increased?
Himalaya Nutravedics reduced its debt-to-equity ratio to 0.1 times in H1 FY27 from 0.3 times in FY26 and 2.4 times in FY24. Short-term borrowings fell to Rs 4.22 crore from Rs 5.13 crore at FY26-end, while long-term borrowings were Rs 49.5 lakh in H1 FY27 after being nil in FY26.
The lower ratio coincided with the larger equity base rather than the removal of borrowings. Total borrowings, comprising Rs 4.22 crore of short-term borrowings and Rs 49.5 lakh of long-term borrowings, were Rs 4.71 crore in H1 FY27. Finance costs nevertheless increased to Rs 30.2 lakh in H1 FY27 from Rs 12.7 lakh in H1 FY26, according to the income statement.
Other current liabilities increased to Rs 1.71 crore in H1 FY27 from Rs 11.1 lakh at FY26-end, while provisions increased to Rs 2.74 crore from Rs 1.96 crore. Trade payables also rose to Rs 1.18 crore from Rs 69.9 lakh. These movements occurred alongside the 5.6-times current ratio, supported by the Rs 26.62 crore cash balance.
Conclusion
Himalaya Nutravedics’ H1 FY27 financial position was reshaped by the financing inflow and IPO-led equity infusion identified in its presentation. Cash reached Rs 26.62 crore, shareholders’ funds reached Rs 47.32 crore and debt-to-equity declined to 0.1 times, while operations still used Rs 65.5 lakh and inventory plus receivables totalled Rs 25.49 crore.
The next items to watch are execution of the disclosed direct-to-consumer, e-commerce and quick-commerce plans, alongside the proposed Rs 7.50 crore deployment from net proceeds for branding, performance marketing and customer-acquisition campaigns. The plan also calls for expanded finished-goods inventory, making future operating cash flow and working-capital movements relevant measures of how the expansion is funded.