










Duroply revenue more than doubled by FY26 as margins varied
Key highlights
- Duroply’s revenue increased from Rs 190.885 crore in FY22 to Rs 402.67 crore in FY26.
- Duroply’s annual EBITDA margin ranged from 3.55% in FY22 to a high of 6.09% in FY23.
- Duroply’s FY26 profit after tax was Rs 2.937 crore, down from Rs 7.770 crore in FY25.
- Duroply reported a 7.05% EBITDA margin in Q2 FY27 and 6.06% in H1 FY27.
powered by IRIS
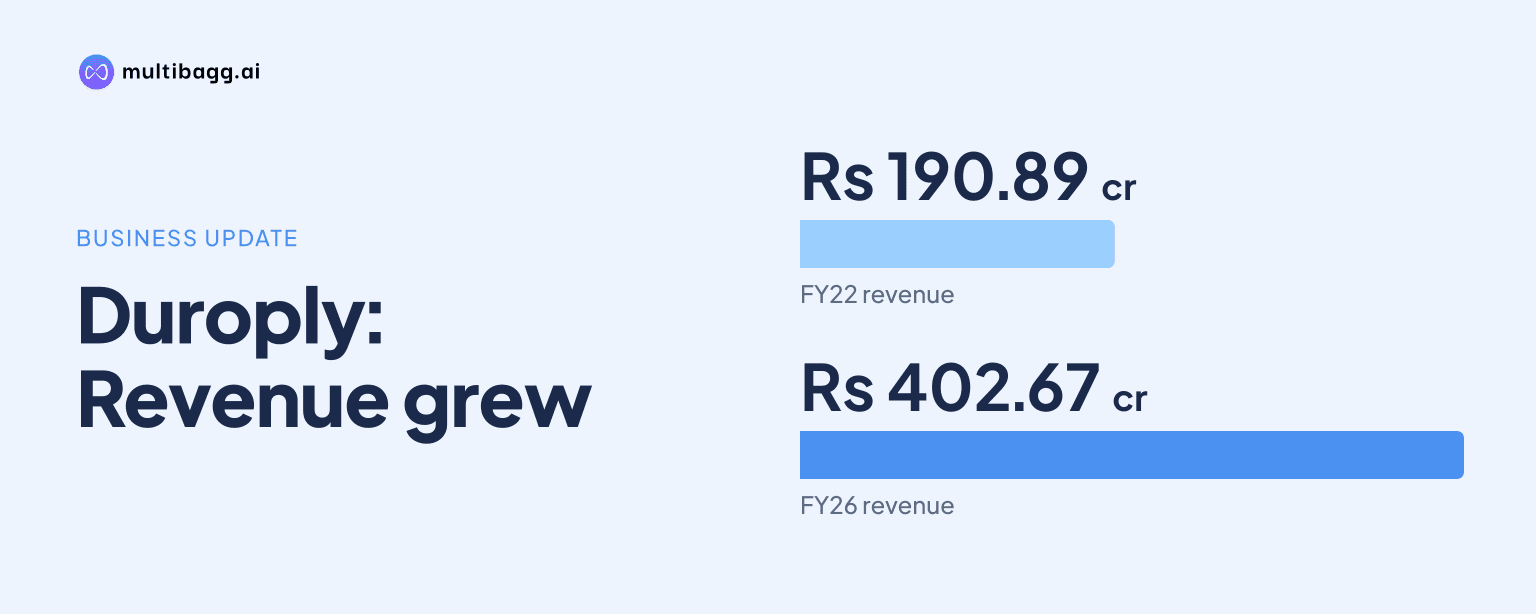
Duroply Industries Limited more than doubled revenue from Rs 190.885 crore in FY22 to Rs 402.67 crore in FY26, while its annual EBITDA margin moved between 3.55% and 6.09%. In FY26, Duroply reported revenue growth over FY25 and an EBITDA margin of 5.57%, but profit after tax fell to Rs 2.937 crore from Rs 7.770 crore.
Know Duroply Industries inside out
Results, valuation, peers and who's buying, in one view.
How did Duroply’s revenue change from FY22 to FY26?
Duroply’s revenue from operations increased in every financial year from FY22 through FY26, rising from Rs 190.885 crore to Rs 402.67 crore. The largest annual increase occurred in FY23, when revenue reached Rs 302.461 crore. Revenue then increased to Rs 323.423 crore in FY24, Rs 371.792 crore in FY25 and Rs 402.67 crore in FY26.
Costs also rose over the period. Cost of goods sold increased from Rs 119.227 crore in FY22 to Rs 261.64 crore in FY26, while operating expenses grew from Rs 67.058 crore to Rs 119.95 crore. Gross profit rose from Rs 71.658 crore to Rs 141.04 crore, although gross margin was 35.02% in FY26, below the 37.54% reported in FY22.
Why did Duroply’s operating margins fluctuate?
Duroply’s EBITDA margin rose from 3.55% in FY22 to 6.09% in FY23, fell to 3.97% in FY24, and then recovered to 4.81% in FY25 and 5.57% in FY26. EBITDA followed the same uneven pattern, increasing from Rs 6.785 crore in FY22 to Rs 18.410 crore in FY23, declining to Rs 12.854 crore in FY24 and reaching Rs 22.434 crore in FY26.
Gross margin declined from 37.54% in FY22 to 35.20% in FY23 and 33.67% in FY24, before rising to 34.72% in FY25 and 35.02% in FY26. Operating expenses increased from Rs 90.089 crore in FY23 to Rs 96.937 crore in FY24, Rs 112.135 crore in FY25 and Rs 119.95 crore in FY26, alongside the expansion in revenue.
The FY26 EBITDA margin was 0.76 percentage points above FY25’s 4.81%, but 0.52 percentage points below FY23’s 6.09%. Other income was Rs 1.35 crore in FY26, compared with Rs 94.2 lakh in FY25 and Rs 2.039 crore in FY23. The presentation reports the income-statement line items but does not state a reason for the annual changes in operating margin.
What happened to Duroply’s profit after tax?
Duroply moved from a profit after tax loss of Rs 6.310 crore in FY22 to a profit of Rs 5.226 crore in FY23, but its subsequent profit record varied. Profit after tax was Rs 1.007 crore in FY24, rose to Rs 7.770 crore in FY25 and declined to Rs 2.937 crore in FY26. PAT margin moved from negative 3.31% in FY22 to 1.73%, 0.31%, 2.09% and 0.73% over the following four years.
Profit before tax increased from Rs 5.815 crore in FY25 to Rs 7.233 crore in FY26 even as profit after tax declined. The income statement records exceptional items of Rs 1.042 crore in FY25 and Rs 27.5 lakh in FY26, while taxation changed from negative Rs 91.3 lakh in FY25 to Rs 4.02 crore in FY26. Interest expense rose from Rs 7.405 crore to Rs 9.11 crore and depreciation increased from Rs 4.677 crore to Rs 6.09 crore.
Got a follow-up? Ask IRIS
How did Duroply’s working capital and financing metrics change?
Duroply’s cash conversion cycle increased from 59 days in FY22 to 115 days in FY26, before declining to 101 days in H1 FY27. Inventory days fell from 195 in FY22 to 145 in FY26, but payable days fell more sharply from 175 to 72. Debtor days were 38 in FY22, reached 47 in FY25, stood at 42 in FY26 and returned to 38 in H1 FY27.
The presentation’s financing indicators also changed between FY23 and FY26. Interest cover rose from 2.7 in FY23 to 3.0 in FY26 after falling to 1.58 in FY24. The gearing ratio moved from 0.47 in FY23 to 0.32 in FY24, 0.39 in FY25 and 0.43 in FY26. Return on capital employed, or RoCE, was 12% in FY23, 5% in FY24 and 8% in both FY25 and FY26.
At March 2026, short-term borrowings were Rs 55.497 crore, up from Rs 45.221 crore at March 2025, while long-term borrowings rose to Rs 9.349 crore from Rs 6.890 crore. Trade payables declined to Rs 51.329 crore from Rs 77.920 crore, inventories declined to Rs 103.886 crore from Rs 109.603 crore, and trade receivables were Rs 46.251 crore compared with Rs 47.590 crore a year earlier.
What does Duroply’s latest FY27 update show?
Duroply reported revenue from operations of Rs 122.242 crore in Q2 FY27, up 22.72% quarter on quarter from Rs 99.614 crore in Q1 FY27 and 16.99% year on year from Rs 104.492 crore in Q2 FY26. Q2 FY27 EBITDA was Rs 8.620 crore, compared with Rs 4.817 crore in Q1 FY27 and Rs 6.462 crore in Q2 FY26. EBITDA margin was 7.05%, compared with 4.84% and 6.18%, respectively.
For H1 FY27, revenue was Rs 221.857 crore, a 12.0% increase from Rs 198.031 crore in H1 FY26. EBITDA rose 13.4% to Rs 13.437 crore and the EBITDA margin was 6.06%, compared with 5.98% in the prior-year half. Profit after tax increased 25.9% to Rs 4.983 crore, while interest expense declined 15.5% to Rs 3.857 crore and depreciation increased 34.6% to Rs 3.681 crore.
Conclusion
Duroply’s FY22-to-FY26 record combines uninterrupted revenue expansion with uneven profitability. Revenue and gross profit increased materially over the five financial years, while EBITDA margin fell after FY23 before recovering in FY25 and FY26. The divergence between higher FY26 profit before tax and lower profit after tax also shows the effect of taxation, interest, depreciation and exceptional items on reported earnings.
The next reported periods will show whether Q2 FY27’s 7.05% EBITDA margin and H1 FY27’s 6.06% margin continue through the financial year. The presentation gives no FY27 revenue, margin or profit target; the disclosed unresolved operating metric is the cash conversion cycle, which was 101 days in H1 FY27 versus 59 days in FY22.