










Duroply cash conversion cycle falls to 101 days in H1 FY27
Key highlights
- Duroply’s cash conversion cycle declined to 101 days in H1 FY27 from 115 days in FY26.
- H1 FY27 inventory days were 151, compared with 145 in FY26 and 134 in FY23.
- Payable days increased to 88 in H1 FY27 from 72 in FY26, but remained below FY23’s 119 days.
- H1 FY27 debtor days fell to 38 from 42 in FY26 while revenue rose 12.0% year on year.
powered by IRIS
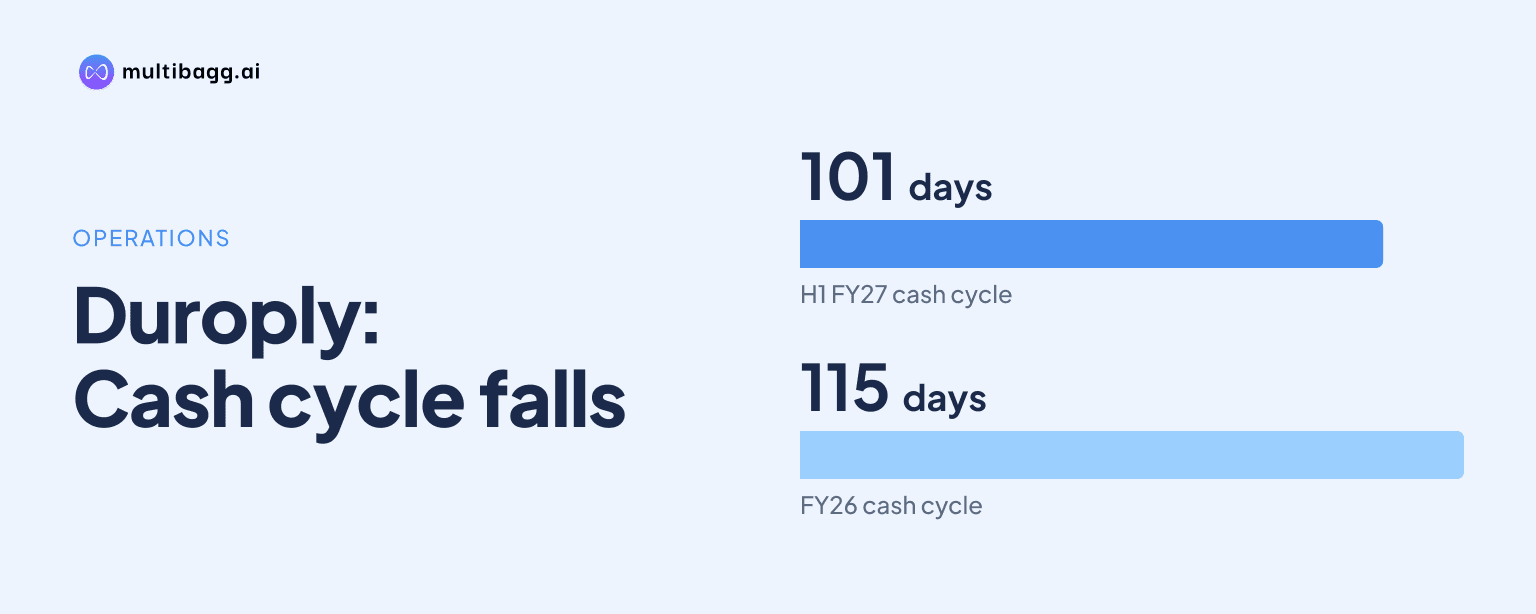
Duroply Industries Limited reduced its cash conversion cycle to 101 days in H1 FY27 from 115 days in FY26, mainly as payable days rose to 88 from 72. The cycle nevertheless remained 52 days above FY23’s 49 days, with inventory at 151 days versus 134 and payables below FY23’s 119 days.
Know Duroply Industries inside out
Results, valuation, peers and who's buying, in one view.
How did Duroply’s cash conversion cycle change in H1 FY27?
Duroply’s cash conversion cycle improved by 14 days to 101 in H1 FY27, reversing part of the 21-day increase reported in FY26. The presentation records a 94-day cycle in FY25, 115 days in FY26 and 101 days in H1 FY27. The latest measure was below FY26 but above every annual reading shown from FY22 through FY25.
The presentation calculates the 101-day cycle from 38 debtor days and 151 inventory days, less 88 payable days. Compared with FY26, debtor days fell by four days and payable days increased by 16 days, while inventory days rose by six days. The combined 20-day benefit from debtors and payables exceeded the six-day inventory increase, resulting in the 14-day reduction.
Why is Duroply’s cash conversion cycle still above FY23 levels?
Duroply’s H1 FY27 cash conversion cycle was 52 days above FY23 because inventory days were 17 days higher, payable days were 31 days lower and debtor days were three days higher. The 151 inventory days and 38 debtor days in H1 FY27 totalled 189 days before the deduction of 88 payable days, compared with 169 days before 119 payable days in FY23.
Inventory was the largest component in the H1 FY27 profile at 151 days, nearly four times the 38 debtor days reported for the same period. Inventory days moved from 134 in FY23 to 149 in FY24, 165 in FY25, 145 in FY26 and 151 in H1 FY27. The H1 FY27 figure was below FY25’s 165 days but above FY23, FY24 and FY26.
Payable days partly offset the combined debtor and inventory duration. Payables rose to 88 days in H1 FY27 from 72 in FY26, but remained below 119 days in FY23 and 117 in FY25. Debtor days returned to 38, matching FY22, and were below 39 in FY24, 47 in FY25 and 42 in FY26, though they remained above FY23’s 35 days.
Got a follow-up? Ask IRIS
Which components drove Duroply’s FY26-to-H1 FY27 improvement?
Duroply’s improvement from FY26 to H1 FY27 was driven chiefly by the 16-day increase in payable days, partly offset by the six-day increase in inventory days. Debtor days added a four-day reduction, falling from 42 to 38. The presentation’s working-capital components therefore show a net 14-day decline in the cash conversion cycle.
FY26 combined 42 debtor days with 145 inventory days and 72 payable days, producing a 115-day cycle. In H1 FY27, debtor and inventory days together rose to 189 from 187 in FY26. The 16-day rise in payables to 88 days more than offset that two-day increase in the combined receivable and inventory duration.
The H1 FY27 profile also differs from FY25. Inventory days fell by 14 days from 165 and debtor days fell by nine days from 47, while payable days declined by 29 days from 117 to 88. As a result, the cash conversion cycle increased to 101 days in H1 FY27 from 94 days in FY25 despite lower debtor and inventory days.
How did Duroply’s H1 FY27 earnings compare with its working-capital profile?
Duroply reported 12.0% year-on-year revenue growth in H1 FY27 alongside a 101-day cash conversion cycle. Revenue from operations rose to Rs 221.857 crore from Rs 198.031 crore in H1 FY26, while earnings before interest, tax, depreciation and amortisation (EBITDA) increased 13.4% to Rs 13.437 crore from Rs 11.852 crore. Gross margin increased to 34.99% from 34.49%, and EBITDA margin rose to 6.06% from 5.98%.
Profit before tax rose 29.5% to Rs 5.898 crore in H1 FY27 from Rs 4.553 crore, while profit after tax increased 25.9% to Rs 4.983 crore from Rs 3.957 crore. Interest expense declined 15.5% to Rs 3.857 crore, whereas depreciation increased 34.6% to Rs 3.681 crore. The presentation does not provide a cash-flow statement, debt balance or explanation for changes in inventory and payable days.
In Q2 FY27, revenue rose 22.72% quarter on quarter to Rs 122.242 crore and 16.99% year on year. EBITDA margin was 7.05%, compared with 4.84% in Q1 FY27 and 6.18% in Q2 FY26, while profit after tax was Rs 4.375 crore. These quarterly results are separate from the H1 FY27 working-capital table, which gives one 101-day cycle reading rather than quarterly cycle data.
Conclusion
Duroply’s 101-day cash conversion cycle in H1 FY27 indicates a partial reversal from FY26’s 115 days, supported by higher payable days and lower debtor days. It remains well above FY23’s 49 days because the H1 FY27 inventory position was higher and supplier-credit days were lower than in FY23, despite the improvement from FY26.
The next reported working-capital data will show whether inventory days move below 151, payable days extend beyond 88 or debtor days improve from 38. Management also disclosed the launch of Duro HDMMR in the medium-density fibreboard category in Q2 FY27, but the presentation gives no cash conversion cycle target, working-capital plan or timetable for returning to earlier levels.