




Regulatory/Compliance Filing
Mankind Pharma RTA Office Address Change
Mankind Pharma informed that its RTA, KFin Technologies, will shift its corporate office effective December 1, 2026. The RTA’s registered office remains unchanged.





IRIS
Multibagg AI is an AI powered stock research and analysis platform. We provide data, information, content, and analytics for publicly traded Indian companies listed on NSE and BSE. AI can make mistakes, check important information.
Prices might be delayed by a few minutes.
Join our Exclusive Community


Join our Exclusive Community
Made with 💙 in India. © Finsky Technologies Pvt Ltd. 2026


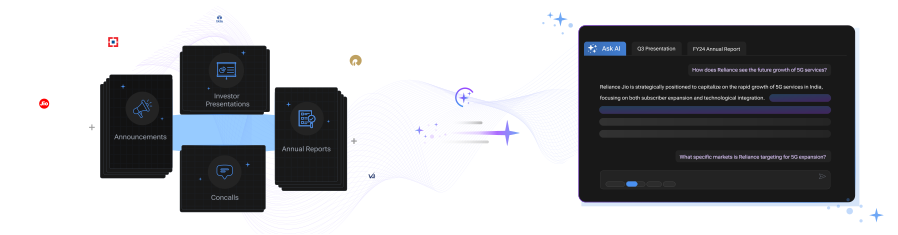
Get instant AI-powered insights about company performance, financials, and strategy. Ask questions about trends, competition, and developments while receiving responses backed by official documents and market data, with clear attribution to source documents.



 Discovery themes featuring this stock
Bearish
1
Neutral
8
Bullish
5
Bearish
7
Neutral
8
Bullish
31
View Standalone
View Standalone
View Standalone
View Standalone
View Standalone
View Standalone
View Standalone
View Standalone



Bearish
6
Neutral
0
Bullish
26
Discovery themes featuring this stock


Mankind Pharma develops, manufactures, and markets pharmaceutical formulations across acute, chronic, specialty, international, and consumer healthcare segments, with products spanning anti-infectives, cardiovascular, gastroenterology, diabetes, respiratory, vitamins, women’s health, and other therapies. Its portfolio also includes consumer brands in contraception, pregnancy testing, antacids, supplements, and anti-acne products.
Q2 FY27 revenue rose 17.3% year-on-year to Rs. 4,338 crore, while EBITDA increased 27.2% to Rs. 1,175 crore. EBITDA margin expanded 210 basis points to 27.1%, supported by gross-margin improvement, operating leverage, higher chronic contribution, pricing, and stronger performance from both the domestic base business and BSV specialty portfolio.
The domestic prescription business regained momentum, with secondary-sales growth of 15.7% versus Indian pharmaceutical market growth of 14.2% excluding tirzepatide. Volume growth improved sequentially from 0.5% in Q2 FY26 to 6.2% in Q2 FY27, indicating that field-force stabilization, portfolio focus, leadership changes, and execution initiatives are beginning to repair earlier underperformance.
Mankind Pharma is deliberately shifting its growth mix toward chronic and specialty therapies. Chronic contribution excluding BSV reached 37.4%, while management continues targeting 50% over four to five years through new divisions, launches, in-licensing, selective acquisitions, specialist engagement, and hospital expansion.
International revenue increased 33% year-on-year to Rs. 680 crore, with BSV branded specialty products and new United States launches contributing meaningfully. However, consumer healthcare remains a weak spot: Q2 revenue was Rs. 229 crore, and management expects only single-digit growth for FY27 while restructuring leadership and accelerating e-commerce distribution.
Pharmaceuticals & Biotechnology
Pharmaceuticals
1,08,557 Cr
Low Risk
48.0
39.0
3.0
6.1
2,705.00
1,909.90
Sales CAGR
Profit CAGR
ROE
ROCE
Mankind Pharma Ltd (MANKIND) is currently trading at 2,628.20 per share. Stock prices fluctuate during market hours on NSE and BSE based on demand, company updates, and overall market conditions. Refer to the live price chart above for the most recent price movement.
Mankind Pharma develops, manufactures, and markets pharmaceutical formulations across acute, chronic, specialty, international, and consumer healthcare segments, with products spanning anti-infectives, cardiovascular, gastroenterology, diabetes, respiratory, vitamins, women’s health, and other therapies. Its portfolio also includes consumer brands in contraception, pregnancy testing, antacids, supplements, and anti-acne products. Q2 FY27 revenue rose 17.3% year-on-year to Rs. 4,338 crore, while EBITDA increased 27.2% to Rs. 1,175 crore. EBITDA margin expanded 210 basis points to 27.1%, supported by gross-margin improvement, operating leverage, higher chronic contribution, pricing, and stronger performance from both the domestic base business and BSV specialty portfolio. The domestic prescription business regained momentum, with secondary-sales growth of 15.7% versus Indian pharmaceutical market growth of 14.2% excluding tirzepatide. Volume growth improved sequentially from 0.5% in Q2 FY26 to 6.2% in Q2 FY27, indicating that field-force stabilization, portfolio focus, leadership changes, and execution initiatives are beginning to repair earlier underperformance. Mankind Pharma is deliberately shifting its growth mix toward chronic and specialty therapies. Chronic contribution excluding BSV reached 37.4%, while management continues targeting 50% over four to five years through new divisions, launches, in-licensing, selective acquisitions, specialist engagement, and hospital expansion. International revenue increased 33% year-on-year to Rs. 680 crore, with BSV branded specialty products and new United States launches contributing meaningfully. However, consumer healthcare remains a weak spot: Q2 revenue was Rs. 229 crore, and management expects only single-digit growth for FY27 while restructuring leadership and accelerating e-commerce distribution.
Over the past 52 weeks, Mankind Pharma Ltd has traded between a low of ₹1,909.90 and a high of ₹2,705.00. The 52-week high and low indicate the stock’s price range over the last year and help investors understand its volatility and recent trading levels.
Mankind Pharma Ltd has a market capitalization of approximately 1,07,612.70. Market capitalization represents the total value of a company’s outstanding shares and helps investors understand its size, stability, and relative risk compared to other listed companies.
Mankind Pharma Ltd’s investment profile depends on its business fundamentals, valuation, and long-term outlook. The stock currently trades at a PE ratio of 47.54 and operates in the its sector sector. Investors typically assess financial performance, growth prospects, and individual risk tolerance before making investment decisions.
Based on its market capitalization of 1,07,612.70 Cr, Mankind Pharma Ltd is classified as a Mid Cap stock. Large-cap stocks are generally more stable, while mid-cap and small-cap stocks tend to offer higher growth potential along with higher price volatility.
Mankind Pharma Ltd operates in the its sector sector. Sector classification matters because companies in the same sector are often affected by similar economic conditions, regulatory changes, and competitive dynamics, which can influence overall stock performance.
The Price-to-Earnings (PE) ratio of Mankind Pharma Ltd is 47.54. The PE ratio compares a company’s share price to its earnings and is commonly used to assess valuation. Comparing the PE ratio with sector peers and historical levels provides better context.
Mankind Pharma reported international revenue of Rs 680 crore in Q2 FY27. The figure was 33% higher year-on-year, compared with 17.3% growth in consolidated revenue from operations.
Mankind Pharma expects single-digit consumer-health growth in FY27 after the segment grew 2.6% in H1 FY27. Management cited slower category offtake and regional effects in eastern and southern India, while saying it was unhappy with the business’s performance.
Mankind said it expects India Rx growth of about 1.1 to 1.2 times the Indian pharmaceutical market over the next two quarters. Management did not provide an absolute percentage target because it said IPM growth is uncertain over the coming two or three quarters.
Q4 FY26 sales were Rs 34.4 billion, while EBITDA margin rose 400 basis points year on year to 27.0%.

| Symbol | Watchlist | Price | Market Cap | P/E | P/B | Div Yield (%) | ROE (%) | ROCE (%) | ROA (%) |
2340.00 | 1,26,433 Cr | 94.80 | 20.86 | 0.09 | 22.11 | 20.91 | 11.58 | ||
1202.70 | 1,19,970 Cr | 28.66 | 4.31 | 0.08 | 15.10 | 14.86 | 7.63 | ||
1387.00 | 1,15,852 Cr | 41.98 | 2.99 | 0.58 | 7.21 | 8.58 | 4.79 | ||
1383.00 | 1,11,731 Cr | 38.95 | 3.16 | 0.94 | 8.18 | 10.80 | 6.60 | ||
2605.35 | 1,07,613 Cr | 47.54 | 6.12 | 0.04 | 12.76 | 14.68 | 7.82 | ||
1792.65 | 1,03,145 Cr | 25.87 | 2.62 | 0.23 | 10.13 | 12.76 | 6.46 | ||
1953.90 | 89,350 Cr | 17.11 | 3.72 | 0.92 | 21.65 | 24.54 | 13.08 | ||
| Median: 7 Co. | — | 1792.65 | 1,11,731 Cr | 38.95 | 3.72 | 0.23 | 12.76 | 14.68 | 7.63 |


