




Financial Results
Singer India Publishes Q2 FY27 Results
Singer India published newspaper advertisements for its unaudited financial results for the quarter and half year ended September 30, 2026.





IRIS
Multibagg AI is an AI powered stock research and analysis platform. We provide data, information, content, and analytics for publicly traded Indian companies listed on NSE and BSE. AI can make mistakes, check important information.
Prices might be delayed by a few minutes.
Join our Exclusive Community


Join our Exclusive Community
Made with 💙 in India. © Finsky Technologies Pvt Ltd. 2026


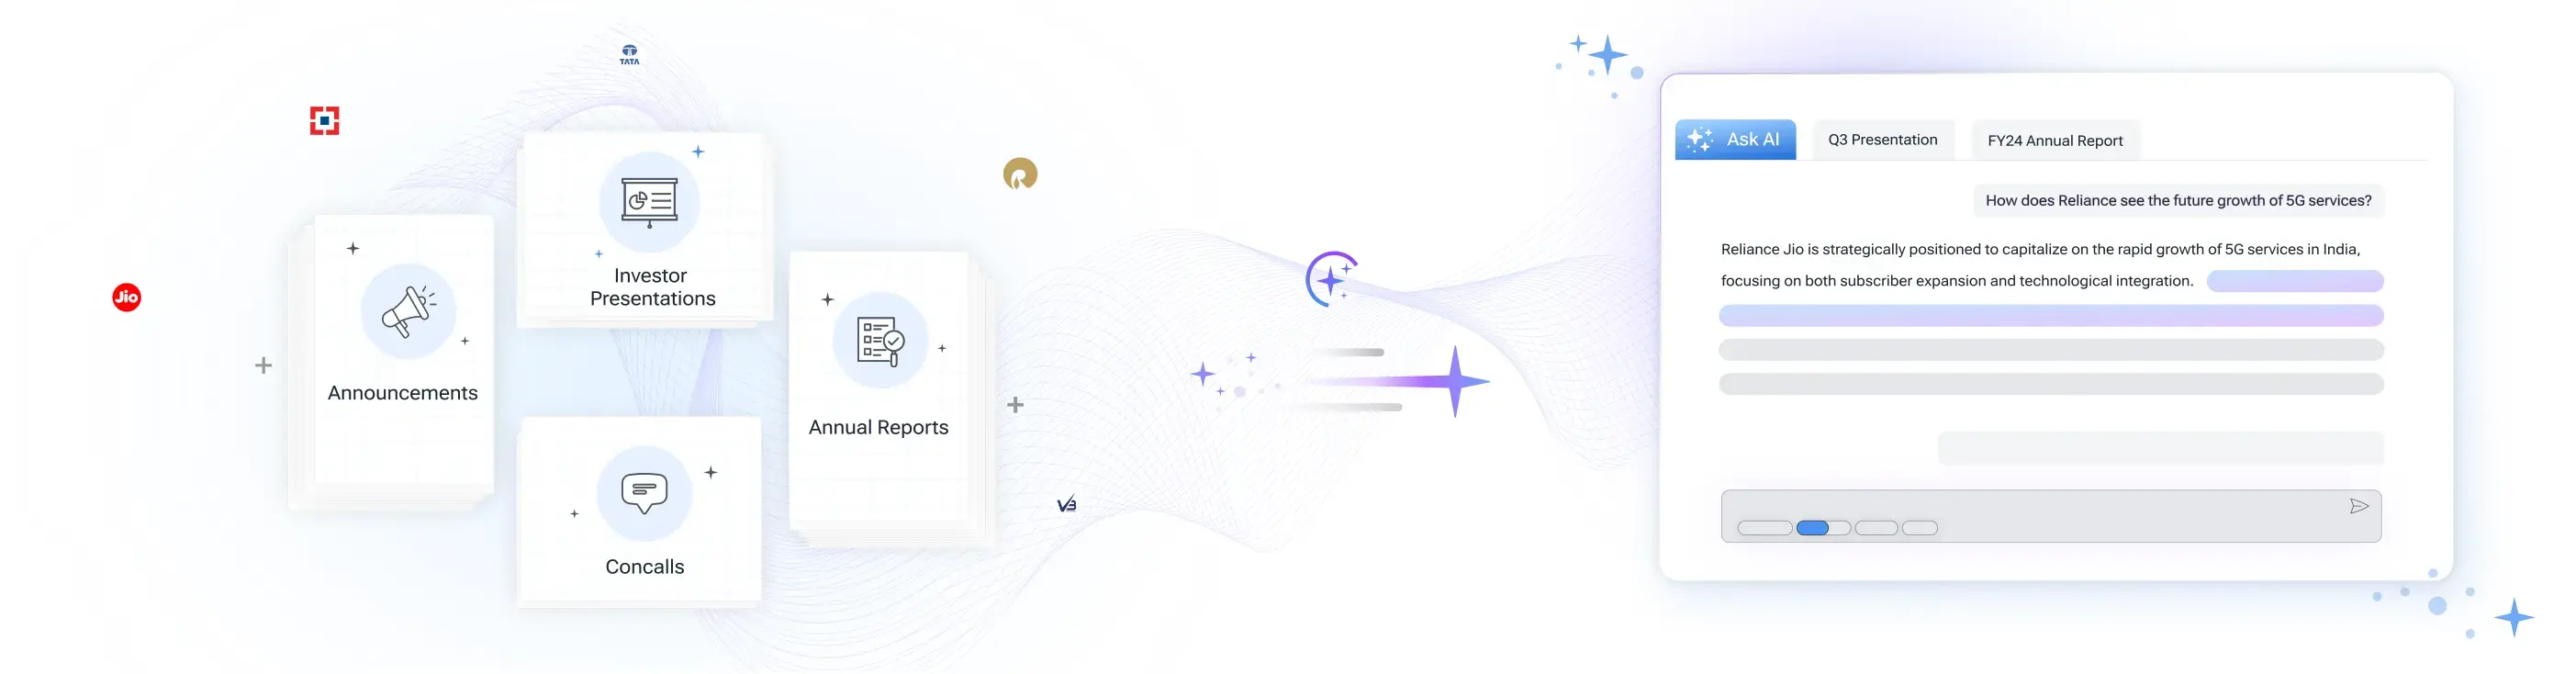
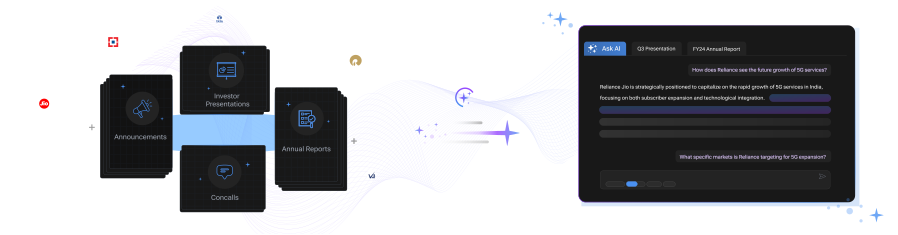
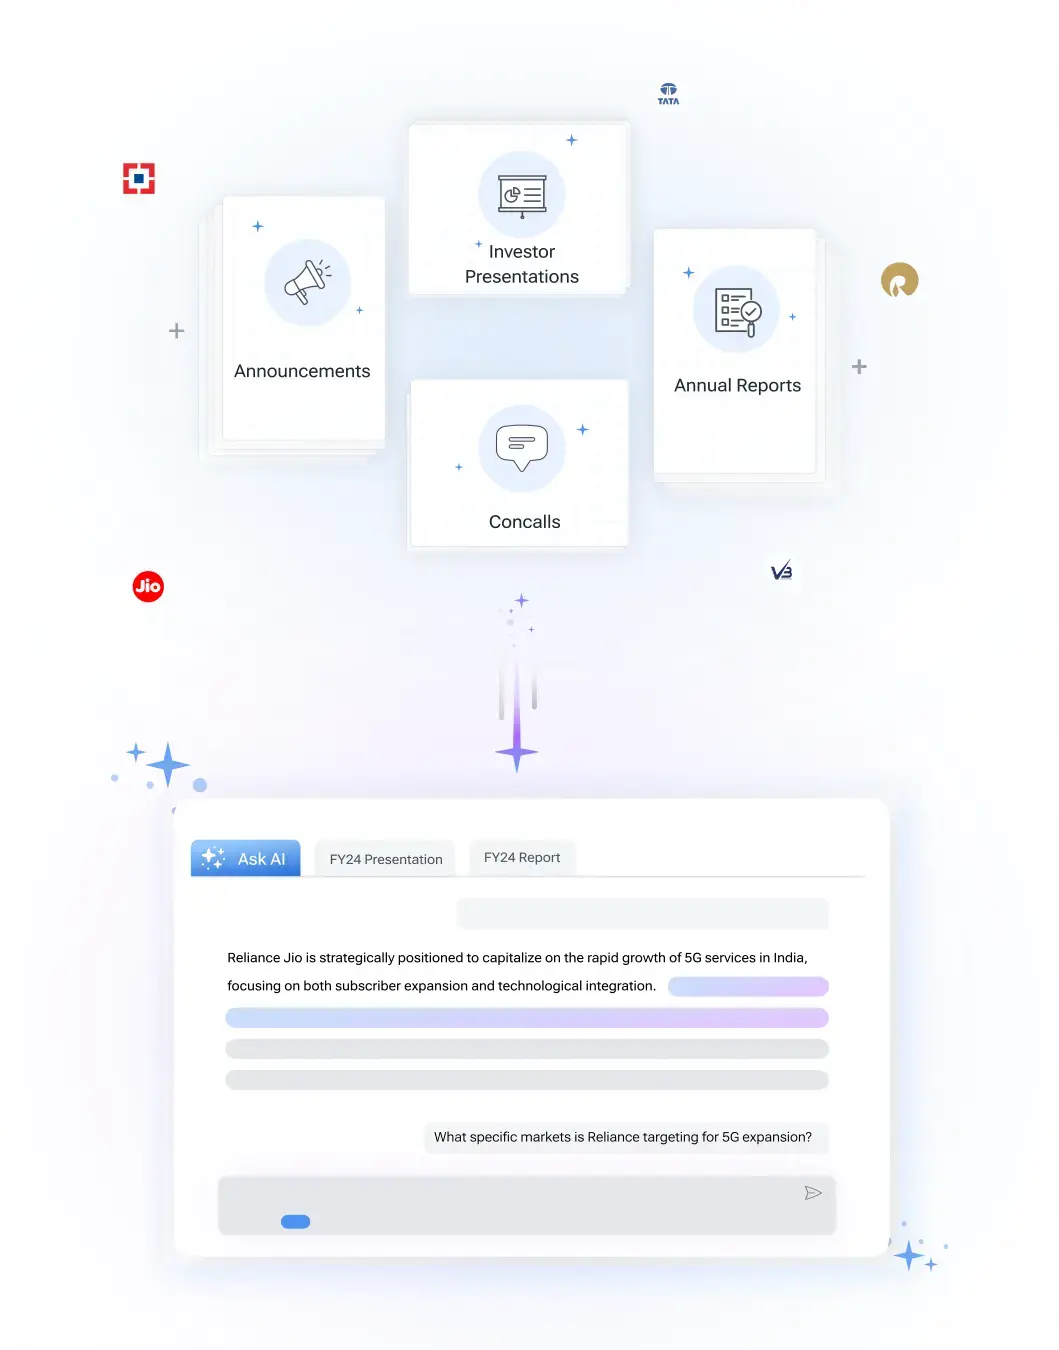
Get instant AI-powered insights about company performance, financials, and strategy. Ask questions about trends, competition, and developments while receiving responses backed by official documents and market data, with clear attribution to source documents.

 Discovery themes featuring this stock


Singer India manufactures and sells sewing machines and home appliances under the Singer and Merritt brands, supported by a Jammu manufacturing facility, more than 6,500 dealers and distributors, over 10,000 retailers, and a nationwide service network. Sewing machines remain the core business, contributing 84% of quarterly product mix and 82% during the first half.
The company delivered a sharp earnings recovery in the first half of FY2026-27, with revenue rising 43.4%, EBITDA increasing 371.1%, and PAT expanding 576.2% year over year. Growth was led by sewing machines, improved gross margins, stronger trade execution, e-commerce market-share gains, and an expanding cast-iron, AZZ, and industrial machine portfolio.
Home appliances are growing rapidly but remain structurally loss-making, with the segment reporting a Rs. 3.1 crore quarterly loss and Rs. 6.2 crore first-half loss. Management attributes this divergence to organization strengthening, higher extended producer responsibility costs, and continued market-expansion investments, making appliance profitability the company’s clearest execution challenge.
Singer India is increasing its India manufacturing and product differentiation, including ten Made-in-India Zig-Zag sewing-machine SKUs compliant with new BIS standards. The company claims to be India’s sole active BIS-licensed Zig-Zag manufacturer, while new fans, e-commerce-focused products, and value-selling initiatives are broadening its growth agenda beyond traditional sewing machines.
Despite higher absolute selling, general, and administrative expenses, operating leverage improved materially: SG&A declined from 25% to 21% of quarterly revenue and from 28% to 23% during the first half. The balance sheet remains unleveraged, although inventory increased to Rs. 144 crore as the company prepares for manufacturing transition and business expansion.
Consumer Durables
Household Appliances
577 Cr
Moderate Risk
72.3
43.5
2.0
3.2
99.59
55.21
Sales CAGR
Profit CAGR
ROE
ROCE

Singer India Ltd (SINGERIND) is currently trading at 93.32 per share. Stock prices fluctuate during market hours on NSE and BSE based on demand, company updates, and overall market conditions. Refer to the live price chart above for the most recent price movement.
Singer India manufactures and sells sewing machines and home appliances under the Singer and Merritt brands, supported by a Jammu manufacturing facility, more than 6,500 dealers and distributors, over 10,000 retailers, and a nationwide service network. Sewing machines remain the core business, contributing 84% of quarterly product mix and 82% during the first half. The company delivered a sharp earnings recovery in the first half of FY2026-27, with revenue rising 43.4%, EBITDA increasing 371.1%, and PAT expanding 576.2% year over year. Growth was led by sewing machines, improved gross margins, stronger trade execution, e-commerce market-share gains, and an expanding cast-iron, AZZ, and industrial machine portfolio. Home appliances are growing rapidly but remain structurally loss-making, with the segment reporting a Rs. 3.1 crore quarterly loss and Rs. 6.2 crore first-half loss. Management attributes this divergence to organization strengthening, higher extended producer responsibility costs, and continued market-expansion investments, making appliance profitability the company’s clearest execution challenge. Singer India is increasing its India manufacturing and product differentiation, including ten Made-in-India Zig-Zag sewing-machine SKUs compliant with new BIS standards. The company claims to be India’s sole active BIS-licensed Zig-Zag manufacturer, while new fans, e-commerce-focused products, and value-selling initiatives are broadening its growth agenda beyond traditional sewing machines. Despite higher absolute selling, general, and administrative expenses, operating leverage improved materially: SG&A declined from 25% to 21% of quarterly revenue and from 28% to 23% during the first half. The balance sheet remains unleveraged, although inventory increased to Rs. 144 crore as the company prepares for manufacturing transition and business expansion.
Over the past 52 weeks, Singer India Ltd has traded between a low of ₹55.21 and a high of ₹99.59. The 52-week high and low indicate the stock’s price range over the last year and help investors understand its volatility and recent trading levels.
Singer India Ltd has a market capitalization of approximately 577.08. Market capitalization represents the total value of a company’s outstanding shares and helps investors understand its size, stability, and relative risk compared to other listed companies.
Singer India Ltd’s investment profile depends on its business fundamentals, valuation, and long-term outlook. The stock currently trades at a PE ratio of 72.32 and operates in the its sector sector. Investors typically assess financial performance, growth prospects, and individual risk tolerance before making investment decisions.
Based on its market capitalization of 577.08 Cr, Singer India Ltd is classified as a Small Cap stock. Large-cap stocks are generally more stable, while mid-cap and small-cap stocks tend to offer higher growth potential along with higher price volatility.
Singer India Ltd operates in the its sector sector. Sector classification matters because companies in the same sector are often affected by similar economic conditions, regulatory changes, and competitive dynamics, which can influence overall stock performance.
The Price-to-Earnings (PE) ratio of Singer India Ltd is 72.32. The PE ratio compares a company’s share price to its earnings and is commonly used to assess valuation. Comparing the PE ratio with sector peers and historical levels provides better context.
Singer reported H1 2026-27 revenue of Rs 329.8 crore, up 43.4% from Rs 230.0 crore in the prior-year first half. Sewing Machine generated Rs 271.4 crore of revenue, while Home Appliance generated Rs 58.4 crore.
Singer India Ltd reported revenue of ₹18,606 crore for Q2 FY27. The quarter ended September 30, 2026, and the figure was included in the company’s un-audited results update.
Singer India declared its Q4 FY26 standalone results on May 27, 2026, for the quarter ended March 31, 2026.
Discovery themes featuring this stockFinancial Results
Singer India published newspaper advertisements for its unaudited financial results for the quarter and half year ended September 30, 2026.
Investor Presentation
Singer India reported Q2 FY27 revenue of Rs 185.2 crore, up 34.3% year on year, with PAT rising 81.2% to Rs 6.9 crore.
Regulatory/Compliance Filing
Singer India disclosed related party transactions for the half year ended 30 September 2026 under Regulation 23(9) of SEBI LODR Regulations.
Regulatory/Compliance Filing
Singer India confirmed no deviation or variation in the use of ₹4.49 crore raised through its preferential issue for the quarter ended September 30, 2026.
Financial Results
Singer India approved unaudited financial results for the quarter and half year ended September 30, 2026, at its November 12, 2026 board meeting.
View Standalone
View Standalone
View Standalone
View Standalone
View Standalone
View Standalone
View Standalone
View Standalone
Bearish
4
Neutral
5
Bullish
5
Bearish
4
Neutral
5
Bullish
37
Bearish
0
Neutral
0
Bullish
32
Bearish
0
Neutral
0
Bullish
32
Bearish
0
Neutral
0
Bullish
32
Bearish
0
Neutral
0
Bullish
32

| Symbol | Watchlist | Price | Market Cap | P/E | P/B | Div Yield (%) | ROE (%) | ROCE (%) | ROA (%) |
581.25 | 1,039 Cr | 20.27 | 2.60 | 0.00 | 12.81 | 17.02 | 8.05 | ||
73.70 | 988 Cr | 79.91 | 9.15 | 0.14 | 11.27 | 10.54 | 3.12 | ||
92.75 | 577 Cr | 72.32 | 3.24 | 0.43 | 11.39 | 15.31 | 7.00 | ||
324.45 | 419 Cr | 40.24 | 2.05 | 0.00 | 5.11 | 6.75 | 4.01 | ||
81.41 | 405 Cr | -25.84 | 0.75 | 0.00 | 1.77 | 2.42 | -1.83 | ||
61.00 | 142 Cr | 946.40 | 1.27 | 0.00 | 0.14 | 4.86 | 0.04 | ||
44.16 | 27 Cr | -149.67 | 3.66 | 0.00 | -2.43 | 1.32 | -1.11 | ||
| Median: 7 Co. | — | 81.41 | 419 Cr | 40.24 | 2.60 | 0.00 | 5.11 | 6.75 | 3.12 |


