










Aarvi net debt-to-equity falls from 0.10x to 0.04x in H1-FY27
Key highlights
- Aarvi's net debt-to-equity ratio declined to 0.04x in H1-FY27 from 0.10x at FY26.
- Aarvi's cash and cash equivalents rose to Rs 14.4 crore from Rs 9.2 crore at FY26.
- Aarvi's trade receivables fell to Rs 93.6 crore from Rs 102.4 crore at FY26.
- Aarvi's current borrowings increased to Rs 27.8 crore from Rs 24.3 crore at FY26.
powered by IRIS
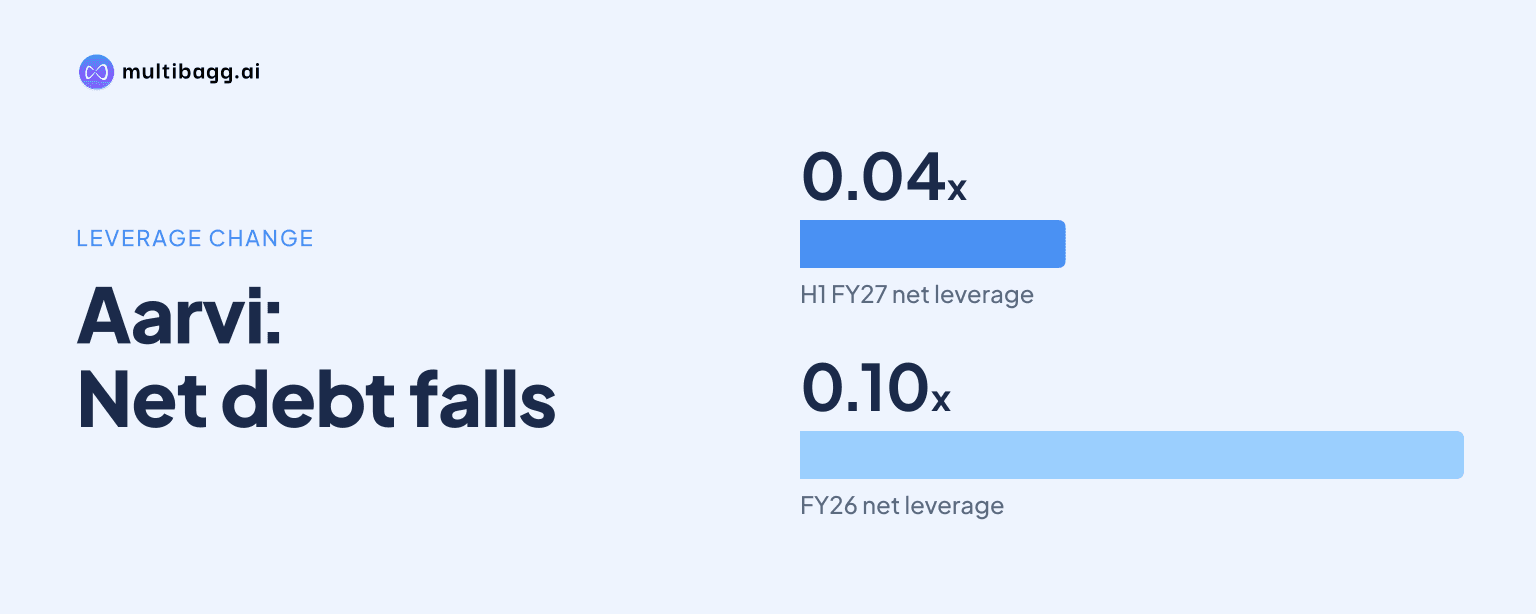
Aarvi Encon Limited reported a 0.04x net debt-to-equity ratio in H1-FY27, down from 0.10x at FY26, as cash and cash equivalents rose to Rs 14.4 crore and trade receivables declined to Rs 93.6 crore. Current borrowings nevertheless increased to Rs 27.8 crore.
Know Aarvi Encon inside out
Results, valuation, peers and who's buying, in one view.
How did Aarvi's net debt-to-equity ratio change in H1-FY27?
Aarvi's reported net debt-to-equity ratio declined to 0.04x in H1-FY27 from 0.10x at FY26 and 0.14x in FY25. The presentation also shows a negative 0.12x ratio in FY24, indicating a net-cash position in that year. From FY26 to H1-FY27, the reported ratio decreased by 0.06x.
Shareholder funds, which Aarvi also presents as net worth in its key metrics, increased to Rs 149.5 crore in H1-FY27 from Rs 142.1 crore at FY26 and Rs 125.3 crore at FY25. Share capital was unchanged at Rs 14.8 crore across all three periods, while other equity increased to Rs 134.7 crore from Rs 127.3 crore at FY26.
What happened to Aarvi's cash and trade receivables?
Aarvi's cash and cash equivalents increased to Rs 14.4 crore in H1-FY27 from Rs 9.2 crore at FY26, a rise of Rs 5.2 crore. Other bank balances increased to Rs 9.4 crore from Rs 3.2 crore, while current investments rose to Rs 5.7 crore from Rs 4.9 crore.
Trade receivables fell to Rs 93.6 crore in H1-FY27 from Rs 102.4 crore at FY26 and Rs 115.5 crore at FY25. Receivables represented 49.9% of current assets of Rs 187.7 crore in H1-FY27, compared with 58.5% of current assets of Rs 175.0 crore at FY26. Other current financial assets increased to Rs 52.3 crore from Rs 45.0 crore.
Why did Aarvi's ratio decline despite higher current borrowings?
Aarvi's current borrowings rose to Rs 27.8 crore in H1-FY27 from Rs 24.3 crore at FY26, an increase of Rs 3.5 crore. Non-current borrowings declined to Rs 1.8 crore from Rs 2.4 crore. Combined current and non-current borrowings were therefore Rs 29.6 crore, compared with Rs 26.7 crore at FY26.
The 0.04x ratio is not a measure of gross borrowings alone because Aarvi does not provide a reconciliation of net debt in the presentation. It does not specify whether cash, other bank balances, current investments or other financial assets are included in the calculation. The disclosed figures show that cash equivalents and shareholder funds increased while current borrowings also increased.
Current liabilities reached Rs 90.2 crore in H1-FY27, compared with Rs 85.5 crore at FY26. Other current financial liabilities increased to Rs 38.2 crore from Rs 33.9 crore, and trade payables rose to Rs 8.8 crore from Rs 7.9 crore. Other current liabilities declined to Rs 10.8 crore from Rs 14.4 crore, while provisions decreased to Rs 4.6 crore from Rs 5.0 crore.
Got a follow-up? Ask IRIS
How did Aarvi's total balance sheet change by H1-FY27?
Aarvi's total assets and total equity and liabilities increased to Rs 248.6 crore in H1-FY27 from Rs 236.9 crore at FY26. Current assets increased by Rs 12.7 crore to Rs 187.7 crore, while non-current assets declined by Rs 1.0 crore to Rs 60.9 crore. The increase in total assets therefore came from current assets.
Property, plant and equipment increased to Rs 17.1 crore in H1-FY27 from Rs 16.4 crore at FY26. Other non-current assets fell to Rs 23.7 crore from Rs 26.1 crore, while other non-current financial assets increased to Rs 16.9 crore from Rs 16.0 crore. Non-current loans and advances declined to Rs 2.4 crore from Rs 2.6 crore.
On the funding side, non-current liabilities fell to Rs 8.9 crore from Rs 9.3 crore, while shareholder funds rose by Rs 7.4 crore and current liabilities increased by Rs 4.7 crore. Shareholder funds represented 60.1% of total equity and liabilities in H1-FY27, compared with 60.0% at FY26. The balance-sheet expansion was therefore accompanied by increases in both equity and current liabilities.
How did H1-FY27 earnings compare with the balance-sheet movement?
Aarvi reported operational income of Rs 333.2 crore in H1-FY27, up 7.4% from Rs 310.2 crore in H1-FY26, but earnings before interest, tax, depreciation and amortisation, or EBITDA, declined 18.1% to Rs 8.6 crore. EBITDA margin declined by 80 basis points to 2.58% from 3.38%; one basis point equals one-hundredth of a percentage point.
Profit after tax increased 6.7% to Rs 9.6 crore from Rs 9.0 crore, while profit-after-tax margin was 2.88% against 2.90% a year earlier. Other income rose to Rs 4.6 crore from Rs 1.3 crore, and profit before tax increased to Rs 10.5 crore from Rs 9.5 crore. Finance cost was Rs 1.6 crore, compared with Rs 1.5 crore in H1-FY26.
Conclusion
Aarvi's H1-FY27 data show a lower reported net debt-to-equity ratio, higher shareholder funds, greater cash holdings and lower trade receivables than at FY26. At the same time, gross borrowings across current and non-current categories increased to Rs 29.6 crore, while current liabilities reached Rs 90.2 crore. The lower ratio should consequently be viewed alongside both the rise in liquidity and the increase in borrowing lines.
The presentation does not disclose a borrowing target, cash target or timetable for a balance-sheet plan. The unresolved matter to watch in subsequent disclosures is a reconciliation of the net-debt calculation, including which of the Rs 14.4 crore cash balance, Rs 9.4 crore other bank balances and Rs 5.7 crore current investments are included. Investors can also track whether receivables remain below the FY26 level of Rs 102.4 crore as operational income develops.