










TBI CORN reaches 390 TPD as utilisation falls to 67% in H1FY27
Key highlights
- TBI CORN reported 390 TPD of fungible capacity in H1FY27, up from 350 TPD in H2FY26.
- TBI CORN’s H1FY27 utilisation was 67%, compared with 72% in H2FY26 and 70% in H1FY26.
- TBI CORN processed 55,724 tonnes in H1FY27, about 24% above 45,009 tonnes in H1FY26.
- TBI CORN reported H1FY27 revenue from operations of Rs 196.46 crore, up 43.7% year on year.
powered by IRIS
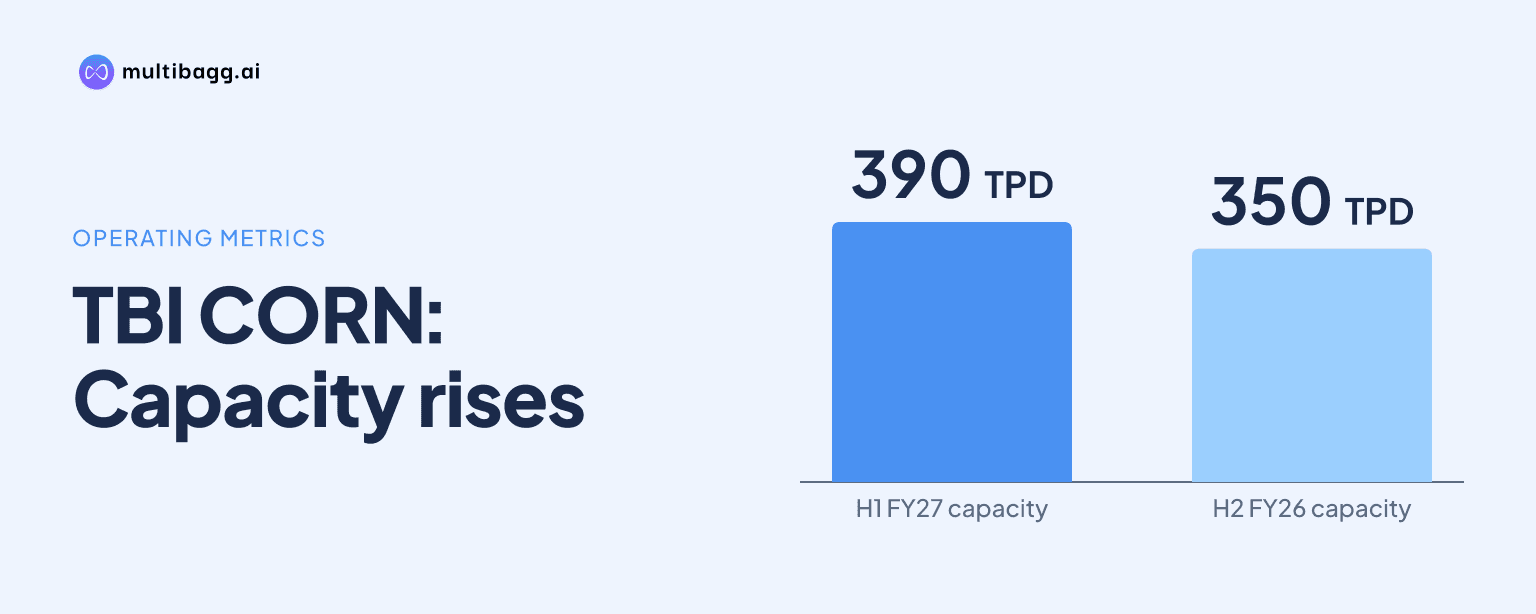
TBI CORN LTD reached 390 tonnes per day of milling capacity in H1FY27, but utilisation fell to 67% as the network expanded, while volumes rose about 24% year on year to 55,724 tonnes. Malkapur’s capacity increased by 40 tonnes per day to 120 tonnes per day, lifting total capacity from 350 tonnes per day in H2FY26.
Know TBI Corn inside out
Results, valuation, peers and who's buying, in one view.
How did TBI CORN reach 390 TPD of capacity?
TBI CORN reached 390 tonnes per day, or TPD, in H1FY27 through 150 TPD at Sangli-I, 120 TPD at Sangli-II and 120 TPD at Malkapur. The presentation states that capacity across these facilities is fungible, meaning it is reported as a combined operating base rather than by separately assigned product capacity.
The immediate H1FY27 addition was 40 TPD at Malkapur, taking its capacity from 80 TPD in H2FY26 to 120 TPD. The wider network had already expanded from 150 TPD in H1FY25 to 350 TPD in H1FY26, when Sangli-II added 120 TPD and Malkapur contributed 80 TPD.
Why did TBI CORN utilisation fall to 67%?
TBI CORN reported 67% utilisation in H1FY27, compared with 72% on 350 TPD in H2FY26, after total available capacity increased to 390 TPD. The presentation does not provide a specific operational explanation for the decline, but it identifies the Malkapur addition as being operationalised at the end of March 2026.
Utilisation was higher when the operating base was smaller, at 98% in H1FY25 on 150 TPD and 87% in H2FY25 on 200 TPD. The subsequent expansion to 350 TPD reduced utilisation to 70% in H1FY26, before a 2-percentage-point recovery in H2FY26 and a further 5-percentage-point decline in H1FY27.
At the 390 TPD base, the reported 67% rate indicates that about one-third of nominal capacity was not utilised during H1FY27. That comparison matters because the 40 TPD increase at Malkapur raised available capacity by 11.4% from the 350 TPD reported in H2FY26, while the company’s disclosed first-half volume growth was about 24% year on year.
Did TBI CORN translate higher capacity into higher volumes?
TBI CORN processed 55,724 tonnes in H1FY27, up from 45,009 tonnes in H1FY26, an increase of 10,715 tonnes or about 24%. Throughput therefore rose despite utilisation falling from 70% in H1FY26 to 67% in H1FY27, reflecting the larger 390 TPD capacity base.
The H1FY27 volume was more than half of the 103,251 tonnes processed in full-year FY26. Annual volume had increased from 55,458 tonnes in FY24 to 71,899 tonnes in FY25, before rising by 31,352 tonnes in FY26, providing the longer historical context for the 55,724 tonnes recorded in the latest first half.
The volume data do not identify plant-wise production, customer-wise tonnage or the share of additional Malkapur capacity used in H1FY27. As a result, the presentation supports a conclusion that total throughput increased by 24%, but not a conclusion on which facility or end-market accounted for that increase.
Got a follow-up? Ask IRIS
What sourcing and product mix changes accompanied H1FY27 growth?
TBI CORN’s direct sourcing accounted for 26% in H1FY27, compared with 25% in FY26 and 11% in FY24, while Agricultural Produce Market Committee, or APMC, sourcing was 74%. The direct share increased by 15 percentage points from FY24, although the presentation does not disclose the purchase-price effect of the sourcing change.
Corn grits and corn bran each represented 29% of H1FY27 revenue, giving the two products a combined 58% share. Corn grits declined from 33% of revenue in FY26 to 29% in H1FY27, while corn bran increased from 23% to 29%; broken maize remained at 15% and processed maize fell from 14% to 13%.
The industry mix also shifted toward animal feed, which accounted for 27% of H1FY27 revenue versus 23% in H1FY26. Snacks represented 51% and namkeen 9%, taking the two categories to 60% of revenue, while bakery and confectionery contributed 8%, oil 4% and breweries 2%.
How did TBI CORN’s financial results compare with capacity use?
TBI CORN reported revenue from operations of Rs 196.46 crore in H1FY27, up 43.7% from Rs 136.70 crore in H1FY26 and 17.7% from Rs 166.98 crore in H2FY26. Revenue grew faster than the approximately 24% increase in first-half volume, but the presentation does not provide pricing, realisation or product-level revenue data to separate those effects.
Earnings before interest, tax, depreciation and amortisation, or EBITDA, were Rs 21.39 crore in H1FY27, compared with Rs 18.39 crore in H1FY26 and Rs 16.44 crore in H2FY26. The EBITDA margin was 10.9%, 2.5 percentage points below 13.4% a year earlier but 1.1 percentage points above the 9.8% reported in the preceding half.
Reported profit after tax, or PAT, was Rs 11.70 crore in H1FY27, up 14.2% from Rs 10.25 crore in H1FY26 and 40.0% from Rs 8.36 crore in H2FY26. Reported PAT margin was 6.0%, compared with 7.5% in H1FY26 and 5.0% in H2FY26, while basic earnings per share were Rs 6.4.
TBI CORN identified breweries as the fastest-growing industry segment, with revenue growth of 73.5% year on year, followed by bakery and confectionery at 50.0% and oil at 26.5%. Domestic revenue contributed 94% in H1FY27 versus 92% in FY26, while export revenue was 6% versus 8%; Maharashtra accounted for 52% of revenue and Gujarat for 16%.
Conclusion
TBI CORN’s H1FY27 results show that capacity expansion has been accompanied by higher throughput and revenue: the network reached 390 TPD, volume rose to 55,724 tonnes and revenue from operations reached Rs 196.46 crore. However, utilisation fell to 67% from 72% in H2FY26, while EBITDA margin remained below the 13.4% reported in H1FY26 at 10.9%.
The next disclosed operating measure to watch is utilisation of the enhanced 390 TPD network alongside volume growth beyond the 24% reported in H1FY27. The presentation does not disclose a further capacity-expansion target or timetable after Malkapur reached 120 TPD, leaving throughput on the current network and the developing direct-sourcing share of 26% as the stated operating measures to monitor.