










TBI Corn H1FY27 revenue up 43.7%, EBITDA margin down
Key highlights
- TBI Corn reported H1FY27 revenue of Rs 196.46 crore, up 43.7% year-on-year.
- TBI Corn reported an H1FY27 EBITDA margin of 10.9%, down 265 basis points year-on-year.
- TBI Corn’s H1FY27 volume increased about 24% to 55,724 tonnes.
- TBI Corn operated 390 TPD of capacity at 67% utilisation in H1FY27.
powered by IRIS
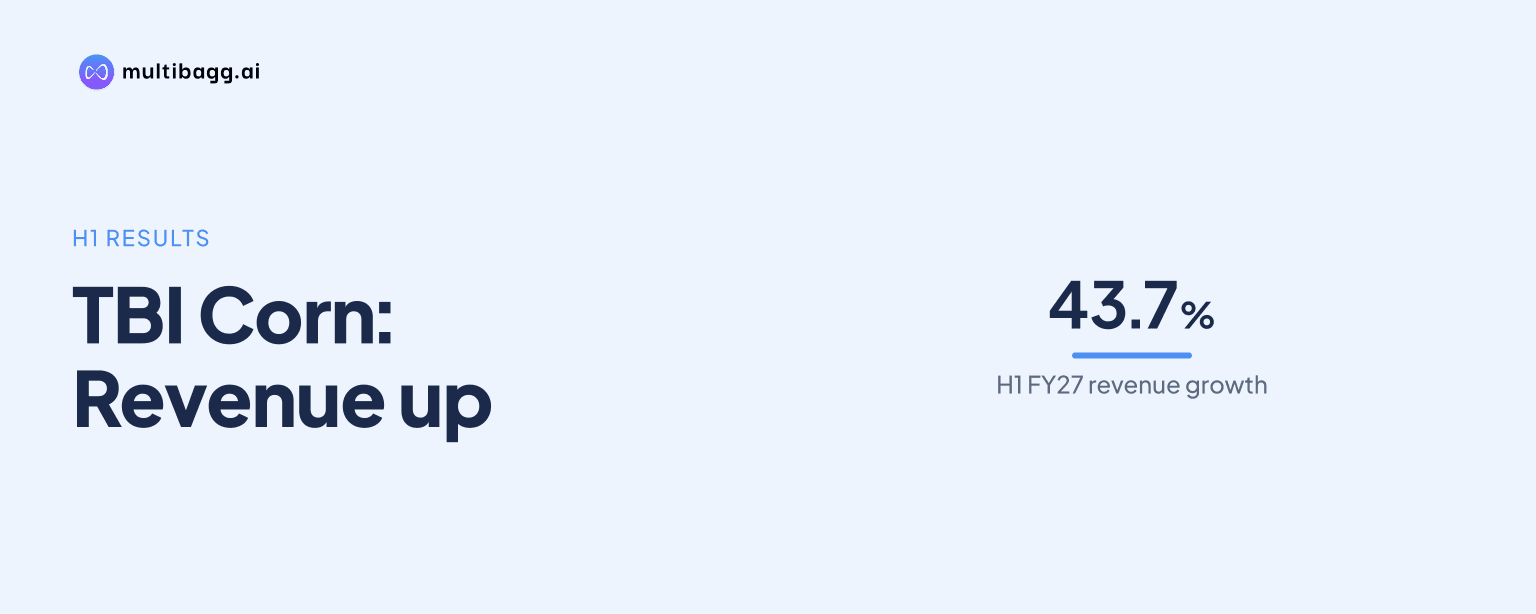
TBI CORN LTD reported H1FY27 revenue from operations of Rs 196.46 crore, up 43.7% year-on-year, while its earnings before interest, tax, depreciation and amortisation (EBITDA) margin declined 265 basis points to 10.9% as total expenditure rose 48.0%, faster than revenue.
Know TBI Corn inside out
Results, valuation, peers and who's buying, in one view.
What did TBI Corn report for H1FY27?
TBI Corn reported revenue from operations of Rs 196.46 crore in H1FY27, compared with Rs 136.70 crore in H1FY26 and Rs 166.98 crore in H2FY26. The year-on-year increase was 43.7%, while the half-on-half increase was 17.7%. EBITDA reached Rs 21.39 crore, up 16.3% from Rs 18.39 crore a year earlier and 30.1% from Rs 16.44 crore in H2FY26.
TBI Corn’s reported profit after tax (PAT) was Rs 11.70 crore in H1FY27, rising 14.2% year-on-year and 40.0% half-on-half. Basic earnings per share (EPS) also increased 14.2% year-on-year to Rs 6.4 from Rs 5.6. Profit before interest and tax (PBIT) rose 18.2% year-on-year to Rs 20.26 crore, while interest expense increased 34.3% to Rs 4.62 crore. Other income was Rs 52 lakh, down 10.5% year-on-year.
Why did TBI Corn’s EBITDA margin decline?
TBI Corn’s EBITDA margin was 10.9% in H1FY27, versus 13.4% in H1FY26, and the income statement reports a 265-basis-point year-on-year decline. Total expenditure increased 48.0% to Rs 175.07 crore, exceeding the 43.7% increase in revenue. EBITDA still increased by Rs 3.00 crore year-on-year, from Rs 18.39 crore to Rs 21.39 crore.
The margin outcome improved from H2FY26, when EBITDA margin was 9.8%. TBI Corn reported a 140-basis-point half-on-half increase in EBITDA margin, as revenue rose 17.7% from Rs 166.98 crore and expenditure increased 16.3% from Rs 150.54 crore. Reported PAT margin similarly rose 95 basis points from 5.0% in H2FY26, but was 154 basis points below the 7.5% reported for H1FY26.
Which customer segments drove TBI Corn’s revenue growth?
TBI Corn said breweries recorded the highest growth among the cited customer segments in H1FY27, at 73.5%. Bakery and confectionery followed with 50.0% growth, while oil grew 26.5%. The presentation identifies these three segments as contributors to the company’s overall 43.7% revenue increase.
Snacking and namkeen accounted for 60% of TBI Corn’s H1FY27 revenue, while corn grit and corn bran continued to account for 58% of total revenue. Animal feed increased its revenue share to 27% from 23% in H1FY26, and the presentation also recorded an increased share from bakery and confectionery. Domestic revenue represented 94% of H1FY27 revenue, compared with 6% from exports.
Got a follow-up? Ask IRIS
How did TBI Corn’s volumes and capacity change?
TBI Corn’s H1FY27 volume was 55,724 metric tonnes, approximately 24% above 45,009 metric tonnes in H1FY26. Available capacity was 390 tonnes per day (TPD), comprising 150 TPD at Sangli-I, 120 TPD at Sangli-II and 120 TPD at Malkapur. The company said 40 TPD of added Malkapur capacity was operationalised at the end of March 2026.
Utilisation was 67% in H1FY27 on the enlarged 390-TPD capacity, compared with 72% in H2FY26 and 70% in H1FY26, when total capacity was 350 TPD. Volume increased year-on-year even as utilisation fell by 3 percentage points from H1FY26, following the Malkapur expansion. TBI Corn describes its capacity as fungible, meaning the disclosed capacity is not allocated to a fixed product line.
What changed in TBI Corn’s corn sourcing?
TBI Corn reported that direct procurement represented 26% of raw-material sourcing in H1FY27, while Agricultural Produce Market Committee (APMC) procurement represented 74%. The company said direct procurement rose by 164 basis points year-on-year. Its longer-period data show direct sourcing at 11% in FY24, 18% in FY25 and 25% in FY26.
The sourcing change accompanied higher throughput, with annual volume increasing from 55,458 tonnes in FY24 to 71,899 tonnes in FY25 and 103,251 tonnes in FY26. H1FY27 volume of 55,724 tonnes exceeded the 45,009 tonnes reported in H1FY26. The presentation does not quantify any procurement-cost saving from direct sourcing or separately identify its effect on the 10.9% EBITDA margin.
Conclusion
TBI Corn delivered higher H1FY27 revenue, volume and absolute EBITDA, with sales reaching Rs 196.46 crore and volume reaching 55,724 tonnes. However, total expenditure increased 48.0%, ahead of the 43.7% revenue increase, and the company reported a 265-basis-point year-on-year decline in EBITDA margin. PAT rose 14.2%, while interest expense increased 34.3%.
The next measures to watch are utilisation of the 390-TPD total capacity, which was 67% in H1FY27, and the relationship between expenditure and revenue growth. TBI Corn’s disclosed capacity plan included the 40-TPD Malkapur addition operationalised at the end of March 2026, while the presentation provides no H2FY27 revenue, margin or profit target.