










TBI Corn animal feed reaches 27% as corn bran rises to 29%
Key highlights
- Animal feed accounted for 27% of TBI Corn’s disclosed industry-wise revenue mix.
- Corn bran increased to 29% of H1FY27 product sales from 23% in FY26.
- Domestic revenue represented 94% of TBI Corn’s H1FY27 sales, while exports represented 6%.
- TBI Corn’s H1FY27 revenue from operations rose 43.7% year on year to Rs 196.46 crore.
powered by IRIS
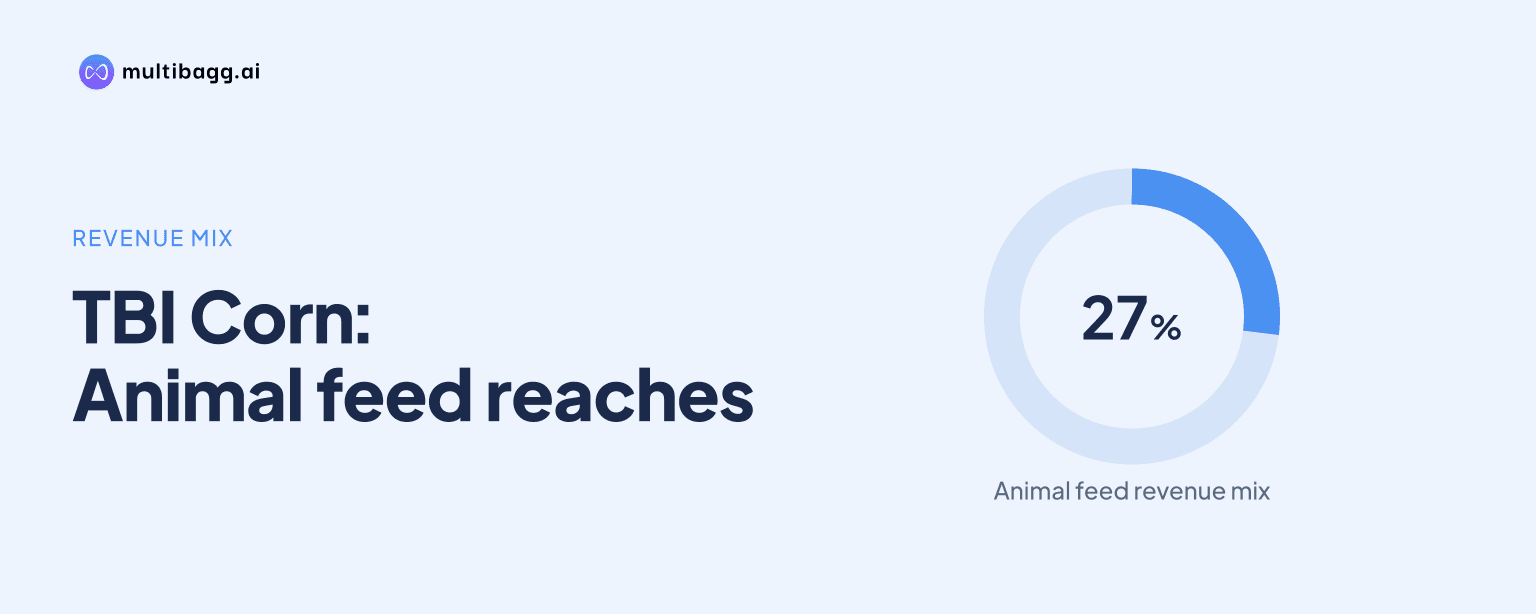
TBI CORN LTD reported animal feed at 27% of its industry-wise revenue mix, while corn bran increased to 29% of H1FY27 product sales from 23% in FY26, equalling corn grits as the largest product category. Revenue from operations rose 43.7% year on year to Rs 196.46 crore in H1FY27.
Know TBI Corn inside out
Results, valuation, peers and who's buying, in one view.
What changed in TBI Corn’s product mix?
TBI Corn’s clearest product-mix change was corn bran’s rise to 29% of H1FY27 segment sales, from 23% in FY26, while corn grits declined to 29% from 33%. Corn bran and corn grits therefore shared the leading position in H1FY27, whereas corn grits had led corn bran by 10 percentage points in FY26.
TBI Corn’s other product shares were either stable or lower in H1FY27. Broken maize remained at 15% versus FY26, processed maize decreased to 13% from 14%, corn flakes fell to 5% from 6%, and other products stayed at 9%. The comparison is between a half-year period and full financial years, so it shows sales composition rather than a like-for-like annual outcome.
How important is animal feed in TBI Corn’s revenue?
Animal feed accounted for 27% of TBI Corn revenue in the disclosed industry-wise mix, making it the second-largest listed end market after snacks at 51%. Namkeen represented 9%, bakery and confectionery 8%, oil 4%, and breweries 2%, leaving snacks and animal feed with a combined 78% share.
TBI Corn does not provide earlier industry-wise revenue shares, so the presentation does not establish whether animal feed’s 27% contribution has increased or declined over time. It also does not map corn bran’s 29% product share to specific customer industries. The two figures describe different views of revenue and do not show that corn bran sales are exclusively made to animal-feed customers.
Where does TBI Corn generate its revenue?
TBI Corn generated 94% of revenue domestically in H1FY27 and 6% from exports. Domestic contribution increased from 92% in FY26 and matched FY25’s 94%, while export contribution fell from 8% in FY26 to 6% in H1FY27.
Maharashtra accounted for 52% of the top-five-state revenue list, followed by Gujarat at 16%, Karnataka at 9%, Uttar Pradesh at 6%, and Punjab at 3%. These five disclosed state shares total 86%, with Maharashtra representing more than half of the listed geographic revenue. The presentation does not provide state-wise figures for prior periods or identify the remaining 14% by state.
Got a follow-up? Ask IRIS
How did growth and capacity change in H1FY27?
TBI Corn reported revenue from operations of Rs 196.46 crore in H1FY27, up 43.7% from Rs 136.70 crore in H1FY26 and 17.7% from Rs 166.98 crore in H2FY26. The presentation identifies breweries as the fastest-growing industry at 73.5% year on year, followed by bakery and confectionery at 50.0% and oil at 26.5%.
TBI Corn processed 55,724 tonnes in H1FY27, compared with 45,009 tonnes in H1FY26, an increase of about 24%. Capacity utilisation was 67% in H1FY27, versus 70% in H1FY26 and 72% in H2FY26, after Malkapur capacity reached 120 tonnes per day from 80 tonnes per day in H1FY26. Total disclosed capacity across Sangli-I, Sangli-II and Malkapur was 390 tonnes per day in H1FY27, against 350 tonnes per day in H1FY26.
What happened to TBI Corn’s margins as revenue grew?
TBI Corn’s earnings before interest, tax, depreciation and amortisation, or EBITDA, increased 16.3% year on year to Rs 21.39 crore in H1FY27, but EBITDA margin declined to 10.9% from 13.4% in H1FY26. Total expenditure rose 48.0% to Rs 175.07 crore, exceeding the 43.7% growth in revenue from operations.
TBI Corn reported profit after tax of Rs 11.70 crore for H1FY27, up 14.2% from Rs 10.25 crore in H1FY26, while reported profit-after-tax margin fell to 6.0% from 7.5%. On a sequential basis, EBITDA margin rose from 9.8% in H2FY26 and reported profit-after-tax margin rose from 5.0%, showing a different comparison from the year-on-year movement.
Conclusion
TBI Corn’s H1FY27 disclosures show a changed product mix, with corn bran rising six percentage points from FY26 to equal corn grits at 29%, while animal feed made up 27% of the industry-wise revenue mix. The company remained primarily domestic, with 94% of revenue from India and Maharashtra accounting for 52% of the top-five-state list, even as revenue rose 43.7% year on year.
The next disclosed operating development to watch is capacity. Management says Sangli-II has been operationalised and Malkapur expansion is under way, while utilisation stood at 67% in H1FY27 on enhanced capacity. Subsequent disclosures can show whether utilisation changes as capacity develops and whether corn bran retains its 29% contribution to product sales.