










Accretion export share nearly doubles to 18.15% in H1 FY27
Key highlights
- Accretion’s export sales represented 18.15% of H1 FY27 revenue, compared with 9.16% in H1 FY26.
- Domestic sales represented 81.85% of H1 FY27 revenue, down from 90.84% a year earlier.
- Income from operations increased 25.83% year on year to Rs 55.04 crore in H1 FY27.
- H1 FY27 EBITDA rose 72.28% to Rs 12.37 crore and PAT rose 72.63% to Rs 8.20 crore.
powered by IRIS
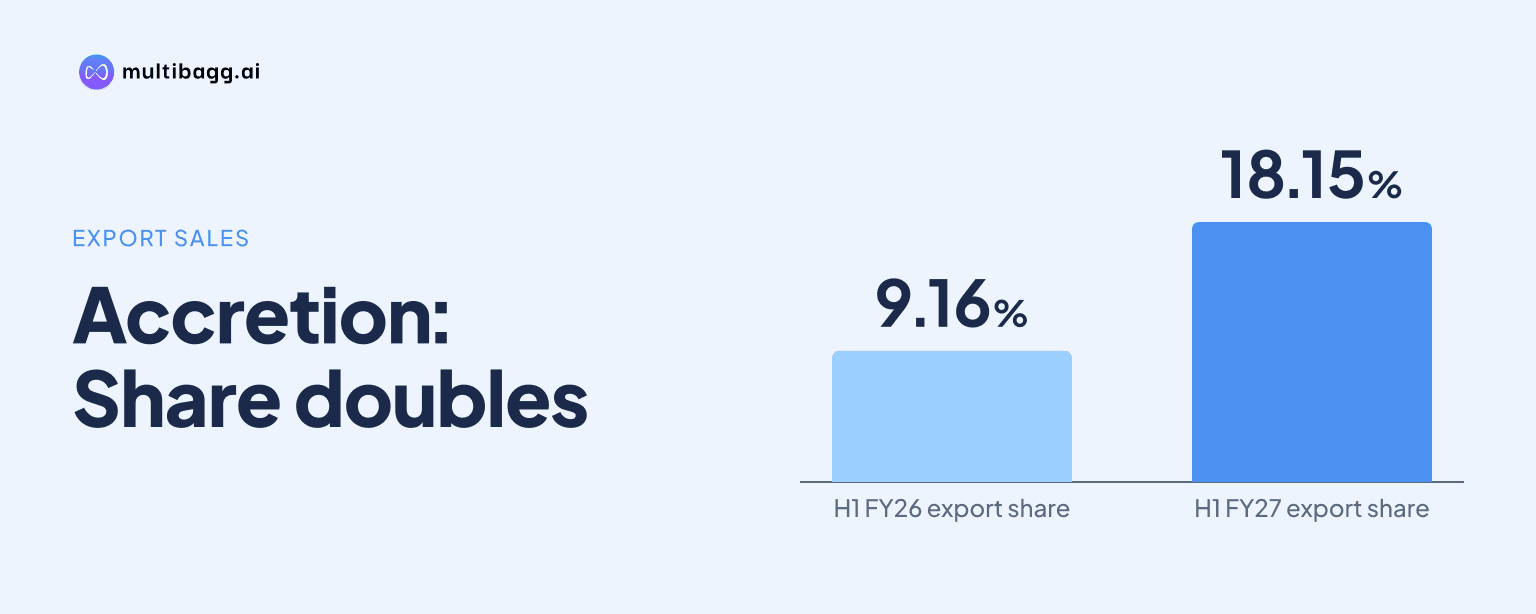
Accretion Pharmaceuticals Limited reported exports at 18.15% of revenue in H1 FY27, nearly double the 9.16% share in H1 FY26, while income from operations increased 25.83% year on year to Rs 55.04 crore. Management cited improved product mix, sustained demand in key categories and a larger international contribution.
Know Accretion Pharmaceuticals inside out
Results, valuation, peers and who's buying, in one view.
How much did Accretion’s export revenue share change in H1 FY27?
Accretion’s export share increased by 8.99 percentage points to 18.15% in H1 FY27 from 9.16% in H1 FY26. Over the same comparison, domestic sales declined by 8.99 percentage points as a proportion of revenue, to 81.85% from 90.84%. The presentation discloses these as mix percentages rather than separate rupee values for exports.
Accretion described the 18.15% export contribution as reflecting its expanding international presence. In the founders’ message, management also linked H1 FY27 performance to improved product mix and sustained demand across key categories. However, the presentation does not provide export growth by country, customer, therapeutic category or dosage form.
How does Accretion’s H1 FY27 export mix compare with prior full years?
Accretion’s 18.15% export share in H1 FY27 was higher than the annual export proportions reported for FY24, FY25 and FY26, which ranged from 7.28% to 8.55%. The FY26 export share of 8.55% was 9.60 percentage points below the H1 FY27 figure, while domestic sales fell to 81.85% in H1 FY27 from 91.45% in FY26.
The annual data show that exports increased gradually by 1.27 percentage points between FY24 and FY26, before the H1 FY27 proportion rose by 9.60 percentage points from the FY26 annual level. H1 FY27 covers six months, unlike FY24 through FY26, which are full financial years. Accretion has not disclosed whether the 18.15% share will continue through H2 FY27 or the full year.
What did the export-mix shift coincide with in Accretion’s results?
The higher export share coincided with income from operations of Rs 55.04 crore in H1 FY27, compared with Rs 43.74 crore in H1 FY26, a 25.83% year-on-year increase. Accretion said revenue growth was supported by business expansion, volume growth, improved product mix and customer additions. It did not allocate the Rs 11.30 crore increase in income from operations between domestic and export sales.
Earnings before interest, tax, depreciation and amortisation, or EBITDA, including other income, rose 72.28% to Rs 12.37 crore from Rs 7.18 crore. EBITDA margin increased to 22.48% from 16.42%, a rise of 606 basis points, with one basis point equal to one-hundredth of a percentage point. Total expenditure increased 16.74% to Rs 42.81 crore, slower than income from operations, while raw-material costs rose to Rs 37.51 crore from Rs 32.16 crore.
Profit after tax, or PAT, increased 72.63% to Rs 8.20 crore in H1 FY27 from Rs 4.75 crore in H1 FY26. PAT margin rose to 14.90% from 10.87%, an increase of 403 basis points, and earnings per share increased to Rs 7.38 from Rs 4.61. These changes occurred alongside the shift in revenue mix, but Accretion does not quantify the export contribution to margin improvement.
Got a follow-up? Ask IRIS
Which products does Accretion disclose for its manufacturing portfolio?
Accretion lists five dosage forms: tablets, capsules, oral liquids, external preparations and oral powder. It also identifies 21 therapeutic segments, including antibiotic, antibacterial, antifungal, anti-inflammatory, anti-diabetic, cardiac and psychotropic products. The presentation does not connect individual forms or therapeutic segments to the 18.15% export share in H1 FY27.
The therapeutic portfolio also includes vitamins and supplements, antitussives, antiparasitic, antiemetic, antiulcer, antacid, anti-malarial and anti-hypertensive products. Management states that its vision is to become a manufacturing and export partner in healthcare by expanding capabilities and global presence. The presentation does not disclose capacity additions, an export-market list, customer concentration or a numerical export target.
Domestic sales remained Accretion’s larger revenue component in H1 FY27 at 81.85%, compared with 18.15% for exports. The mix therefore became more export-weighted without changing the company’s domestic-led revenue structure. Domestic sales had represented more than 91% of annual revenue in FY24, FY25 and FY26, including 91.45% in FY26.
Conclusion
Accretion’s H1 FY27 results show a marked revenue-composition change, with exports reaching 18.15% from 9.16% a year earlier as income from operations rose to Rs 55.04 crore. EBITDA increased to Rs 12.37 crore and PAT reached Rs 8.20 crore, while both reported margins exceeded their H1 FY26 levels. The presentation shows that export contribution and profitability rose in the same period, but does not establish a direct causal link.
The next disclosed execution area is Accretion’s plan to expand its capabilities and global presence. Future results will show whether the 18.15% H1 FY27 export share continues in H2 FY27 and whether domestic sales remain near the H1 FY27 level of 81.85% of revenue. Management has not provided an export target, market-level breakdown or product-level export split.