










Anthem Biosciences Limited H1 profit rises 7.2% as revenue falls
Key highlights
- Anthem Biosciences’ H1FY27 profit after tax rose 7.2% to Rs 331.4 crore despite a 7.2% decline in revenue from operations.
- H1FY27 material and inventory costs fell 27.2% to Rs 330.9 crore, while EBITDA margin rose 480 basis points to 46.2%.
- CRDMO generated Rs 850.1 crore, or 84.0%, of Anthem Biosciences’ H1FY27 revenue from operations.
- Net cash was Rs 1,538 crore at September 30, 2026, compared with Rs 993.1 crore a year earlier.
powered by IRIS
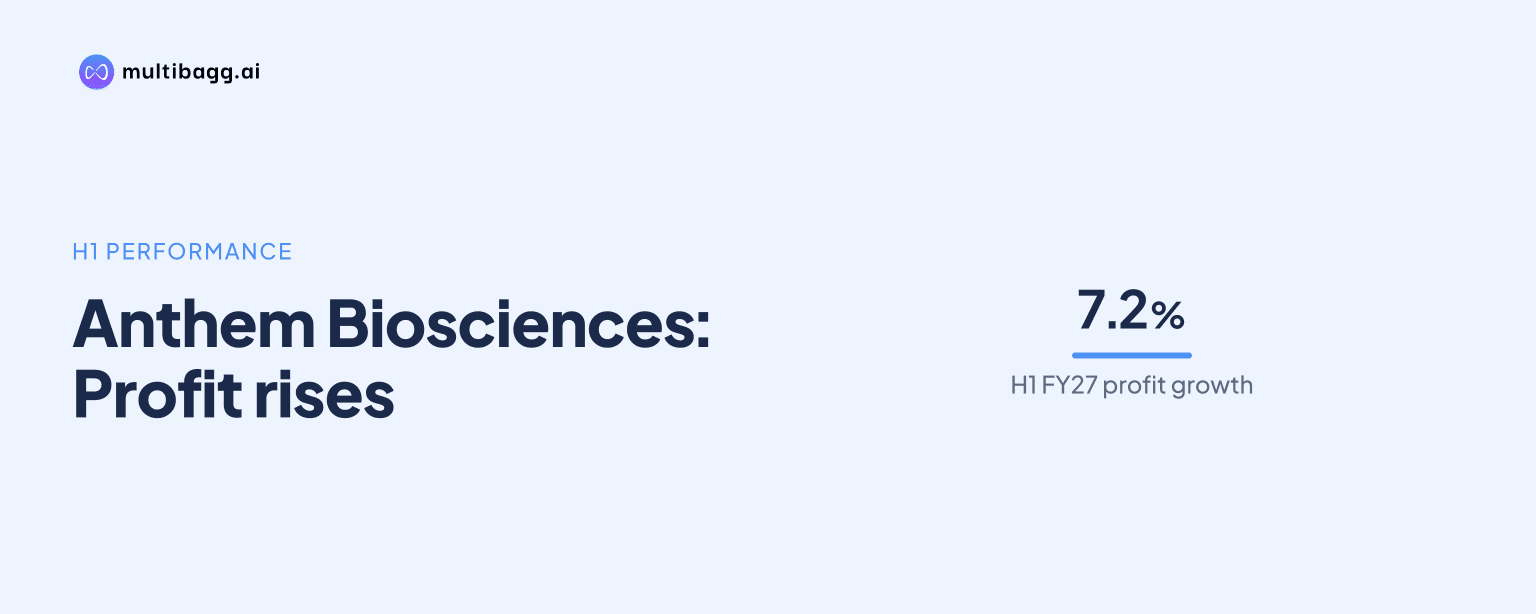
Anthem Biosciences Limited increased H1FY27 profit after tax by 7.2% year on year to Rs 331.4 crore, despite a 7.2% decline in revenue from operations to Rs 1,012.3 crore, as material and inventory costs fell 27.2% and EBITDA margin expanded 480 basis points to 46.2%.
Know Anthem Biosciences inside out
Results, valuation, peers and who's buying, in one view.
How did Anthem Biosciences grow profit while revenue declined?
Anthem Biosciences grew H1FY27 profit because the reduction in material and inventory costs was larger than the fall in operating revenue. Revenue from operations declined by Rs 79.1 crore from Rs 1,091.4 crore in H1FY26 to Rs 1,012.3 crore in H1FY27. Yet earnings before interest, tax, depreciation and amortisation, or EBITDA, increased 5.3% to Rs 505.9 crore from Rs 480.5 crore.
The principal cost movement was in materials consumed and changes in inventories, which decreased by Rs 123.3 crore to Rs 330.9 crore. That was a 27.2% year-on-year decline. This reduction outweighed a Rs 21.0 crore increase in employee benefits expense to Rs 160.1 crore and an Rs 11.7 crore increase in other expenses to Rs 99.2 crore. The company’s EBITDA margin therefore rose from 41.4% to 46.2%.
Profit before tax increased 6.0% to Rs 441.0 crore, after finance cost fell 11.0% to Rs 4.2 crore and depreciation and amortisation increased 1.3% to Rs 60.7 crore. Tax expense rose 2.8% to Rs 109.6 crore. The resulting profit after tax margin was 30.2%, compared with 26.6% a year earlier, a 360-basis-point increase.
Which Anthem Biosciences businesses recorded lower H1 revenue?
Both reported operating segments recorded lower H1FY27 revenue, with the larger contract research, development and manufacturing organisation business accounting for most of the decline. CRDMO revenue fell 7.6% to Rs 850.1 crore from Rs 919.5 crore in H1FY26, a reduction of Rs 69.4 crore. Specialty Ingredients revenue declined 5.6% to Rs 162.2 crore from Rs 171.8 crore.
CRDMO nevertheless remained Anthem Biosciences’ main revenue source, representing 84.0% of H1FY27 revenue from operations, while Specialty Ingredients accounted for 16.0%. The segment mix indicates that the Rs 79.1 crore overall operating-revenue reduction largely reflected the Rs 69.4 crore movement in CRDMO, rather than Specialty Ingredients alone.
The half-year comparison contrasts with the second quarter. Q2FY27 revenue from operations increased 7.9% year on year to Rs 594.0 crore, with CRDMO revenue up 9.2% to Rs 509.3 crore and Specialty Ingredients revenue up 0.6% to Rs 84.8 crore. Q2FY27 revenue was also 42.0% above Q1FY27 revenue of Rs 418.2 crore, showing that the stronger second quarter followed a lower first-quarter base.
Management said the Q2FY27 result was driven by the CRDMO revenue stream and that underlying demand remained strong. Chairman, Managing Director and Chief Executive Officer Ajay Bhardwaj also cited cost efficiencies, yield optimisation and workforce productivity as measures supporting year-on-year EBITDA and profit-after-tax margin expansion. These are management statements rather than quantified H1 segment-volume measures.
Got a follow-up? Ask IRIS
How much did Anthem Biosciences’ margins improve in H1FY27?
Anthem Biosciences’ EBITDA margin improved by 480 basis points to 46.2% in H1FY27, while profit before tax margin rose 440 basis points to 40.2% and profit after tax margin increased 360 basis points to 30.2%. These gains occurred while total revenue, which includes other income, declined 5.6% to Rs 1,096.0 crore from Rs 1,161.3 crore.
Other income increased 19.9% to Rs 83.8 crore from Rs 69.9 crore. Anthem Biosciences states that H1FY27 EBITDA included Rs 83.8 crore of other income, comprising Rs 7.0 crore of foreign-exchange gain and Rs 76.8 crore of financial or non-operating income. In H1FY26, the comparable other-income figure was Rs 69.9 crore, including Rs 34.0 crore of foreign-exchange gain and Rs 35.9 crore of financial or non-operating income.
The margin outcome was more pronounced in Q2FY27. EBITDA rose 24.1% year on year to Rs 330.4 crore and its margin increased to 50.6% from 44.5%, while profit after tax grew 21.9% to Rs 211.5 crore and its margin reached 32.4% from 29.0%. Q2FY27’s other income was Rs 58.9 crore, including Rs 53.1 crore of financial or non-operating income.
The cost pattern explains why a revenue comparison alone does not describe the period’s profit outcome. H1FY27 operating revenue was lower, but materials and inventory costs represented Rs 330.9 crore versus Rs 454.2 crore a year earlier. Meanwhile, employee and other expenses combined rose to Rs 259.3 crore from Rs 226.6 crore, so the disclosed material-cost change was the largest expense movement in the half-year statement.
What was Anthem Biosciences’ cash position at September 2026?
Anthem Biosciences reported net cash of Rs 1,538 crore at September 30, 2026, up Rs 544.9 crore from Rs 993.1 crore at September 30, 2025. The company also reported Rs 1,719.7 crore of net cash at June 30, 2026, meaning the September balance was Rs 181.7 crore lower than the immediately preceding quarter-end.
Against H1FY27 EBITDA of Rs 505.9 crore, Anthem Biosciences presented net cash as 1.52 times annualised H1 EBITDA. Its H1FY27 return on equity, or ROE, was 21.0%, and post-tax return on capital employed, or ROCE, was 39.3%. Gross fixed-assets turnover was 1.32 times for the half year, compared with the company’s Q2FY27 presentation of 1.55 times.
The company disclosed 2,344 employees, including 1,173 scientific staff, alongside 425 kilolitres of custom-synthesis capacity and 142 kilolitres of fermentation capacity. These are operating-capacity measures supplied with the Q2FY27 presentation, while the H1 revenue disclosure identifies 15 commercial and nine late-stage Phase III molecules. Commercial molecules contributed 65.3% of H1 revenue, and research and development services contributed 8.1%.
What should readers compare in the next Anthem Biosciences update?
Readers should compare whether operating revenue growth persists after Q2FY27, when revenue from operations reached Rs 594.0 crore, against the H1FY27 total of Rs 1,012.3 crore. The key segment measure will be CRDMO revenue, which was Rs 850.1 crore for H1FY27 after falling 7.6% year on year, but rose 9.2% year on year in Q2FY27.
Readers should also track the relationship between material costs and margins. Materials and inventory costs fell 27.2% in H1FY27, producing a 46.2% EBITDA margin, while management said it intends to sustain performance through cost efficiencies, yield optimisation and workforce productivity for the full year. The presentation does not provide a numerical full-year revenue, margin or profit target.
Conclusion
Anthem Biosciences delivered higher H1FY27 profit despite lower operating revenue because the Rs 123.3 crore reduction in material and inventory costs exceeded the increases in employee and other expenses. CRDMO remained 84.0% of operating revenue and was the principal contributor to the half-year sales decline, even as the segment drove year-on-year growth in Q2FY27.
The next update will show whether Q2FY27’s Rs 594.0 crore operating revenue and 50.6% EBITDA margin can be maintained. Management has said it is positioned to sustain its performance through the year, citing cost efficiency, yield optimisation and workforce productivity, but it has disclosed no quantified full-year target.