










Anup Engineering H1 profit fell 88% as margins narrowed
Key highlights
- Anup Engineering reported H1 FY27 PAT of Rs 7.2 crore, down 87.7% from Rs 58.3 crore in H1 FY26.
- H1 FY27 revenue declined 24.5% to Rs 307.6 crore and EBITDA margin fell to 8.8% from 22.5%.
- Q2 FY27 revenue rose 45.7% sequentially to Rs 182.4 crore, with EBITDA margin improving to 9.6% from 7.6%.
- Anup Engineering disclosed an order book including LOIs of Rs 941 crore and thermal-power orders exceeding Rs 150 crore.
powered by IRIS
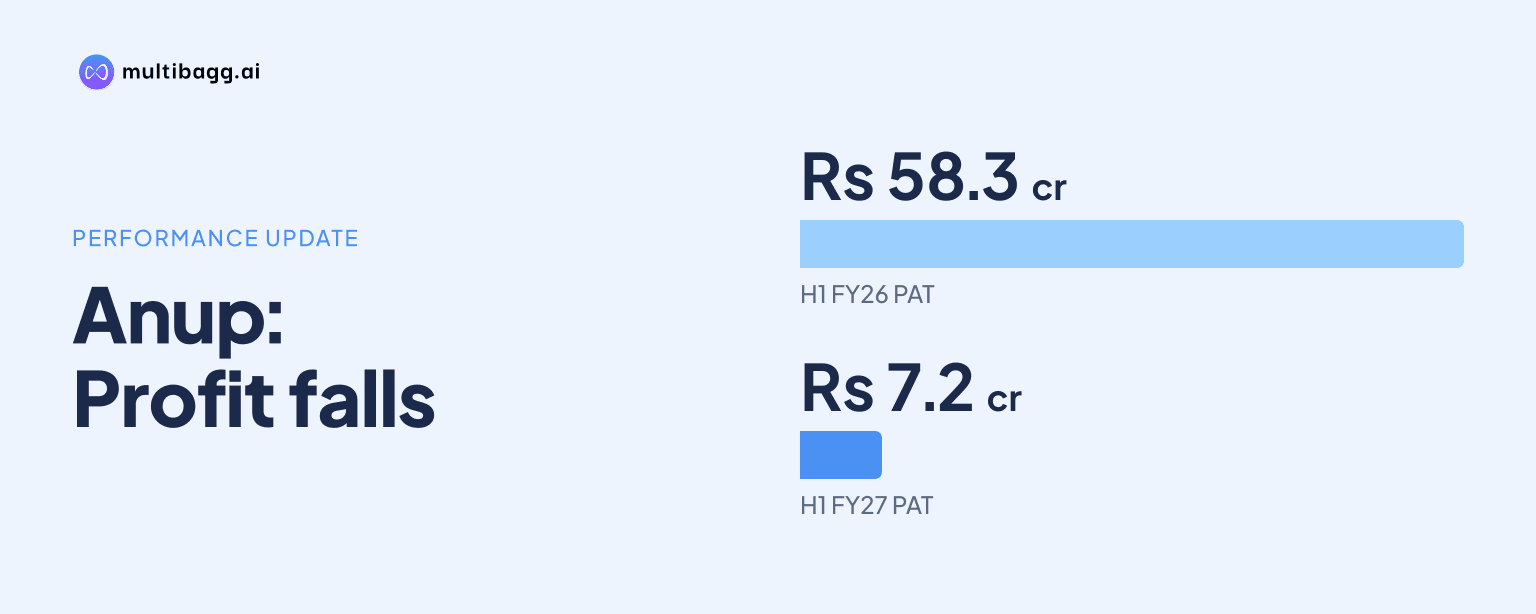
Anup Engineering reported consolidated profit after tax of Rs 7.2 crore in H1 FY27, down 87.7% from Rs 58.3 crore a year earlier, as revenue fell 24.5% to Rs 307.6 crore and EBITDA margin declined to 8.8% from 22.5%. Management cited lower revenue, fixed-cost under-absorption and a 6% rise in raw-material costs.
Know The Anup Engineering inside out
Results, valuation, peers and who's buying, in one view.
What drove Anup Engineering's H1 FY27 profit decline?
Anup Engineering's H1 FY27 profit decline was driven by a lower revenue base and a larger fall in operating earnings. Revenue from operations declined by Rs 99.9 crore to Rs 307.6 crore from Rs 407.5 crore in H1 FY26, while earnings before interest, tax, depreciation and amortisation, or EBITDA, fell 70.6% to Rs 27 crore from Rs 91.8 crore.
Management said lower H1 FY27 revenue led to under-absorption of fixed costs. It also said elevated geopolitical tensions increased raw-material costs by 6%, adding pressure on profitability. EBITDA margin consequently declined by 13.7 percentage points to 8.8% from 22.5% in H1 FY26.
The decline continued below EBITDA. Profit before tax, or PBT, decreased 87.4% to Rs 9.8 crore from Rs 78.3 crore, and the PBT margin declined to 3.2% from 19.2%. PAT margin was 2.3% in H1 FY27, compared with 14.3% in H1 FY26.
Did Anup Engineering recover in Q2 FY27?
Anup Engineering recovered sequentially in Q2 FY27, although its quarterly performance remained below Q2 FY26. Revenue rose 45.7% quarter on quarter to Rs 182.4 crore from Rs 125.2 crore in Q1 FY27. EBITDA increased 84.2% to Rs 17.5 crore from Rs 9.5 crore, while EBITDA margin improved to 9.6% from 7.6%.
The Q2 recovery lifted PAT to Rs 6.6 crore from Rs 0.6 crore in Q1 FY27. PBT rose to Rs 8.9 crore from Rs 0.9 crore, and PBT margin increased to 4.9% from 0.7%. Management described the quarter as a strong sequential recovery consistent with its commentary during the first-quarter call.
The year-on-year comparison remained adverse. Q2 FY27 revenue of Rs 182.4 crore was 21.5% below Rs 232.3 crore in Q2 FY26, while EBITDA of Rs 17.5 crore was 66.0% below Rs 51.5 crore. PAT fell 79.5% to Rs 6.6 crore from Rs 32 crore, and EBITDA margin was 9.6% versus 22.2%.
Which products and markets made up Anup Engineering's H1 revenue?
Anup Engineering's H1 FY27 product revenue was led by heat exchangers at Rs 157 crore, or 51% of the Rs 308 crore presentation total. Vessels generated Rs 113 crore, or 37%, meaning the two categories accounted for 88% of the total. The presentation's Rs 308 crore product total is rounded, compared with reported revenue from operations of Rs 307.6 crore.
Centrifuge and other products contributed Rs 21 crore, or 7%, followed by tank and silos at Rs 11 crore, or 3%. Towers and reactors generated Rs 7 crore, or 2%. Heat-exchanger revenue was therefore Rs 44 crore above vessels revenue during H1 FY27.
Oil and gas represented 57% of Anup Engineering's H1 FY27 business, the largest disclosed industry share. Power and energy accounted for 12%, chemicals and silos for 11%, petrochemicals for 10%, fertilizers for 9%, and hydrogen for 7%. These disclosed industry shares total 106%, and the presentation does not explain the overlap.
Exports generated Rs 149 crore, or 49%, of the Rs 308 crore market-revenue total, compared with domestic revenue of Rs 145 crore, or 47%. Domestic tariff area and special economic zone revenue was Rs 13 crore, or 4%. Exports were Rs 4 crore higher than domestic revenue in H1 FY27.
Got a follow-up? Ask IRIS
What operating pipeline did Anup Engineering disclose after H1 FY27?
Anup Engineering disclosed an order book, including letters of intent, or LOIs, of Rs 941 crore as of the presentation date. Management said this provided revenue visibility, but the presentation does not separate firm orders from LOIs or provide a delivery timetable for the Rs 941 crore pipeline.
Anup Engineering also secured orders exceeding Rs 150 crore for thermal power plants. Management said these orders marked its entry into a group of manufacturers capable of supplying critical heat exchangers to the sector. The presentation does not state when the thermal-power orders will be recognised as revenue or their expected margin.
Management said Anup Engineering secured orders for three proprietary licensed products in high-value niche segments. Its technical and site-services business had three site executions in progress and was on track for revenue of about Rs 50 crore in the current year. Management described the vertical as profitable but did not disclose its margin or a prior-year revenue figure.
What changed in Anup Engineering's balance sheet by September 2026?
Anup Engineering's total assets and total liabilities each stood at Rs 924 crore on 30 September 2026, compared with Rs 958 crore at 31 March 2026. Net worth was Rs 678 crore, down from Rs 691 crore, while current assets declined to Rs 516 crore from Rs 552 crore.
Long-term borrowings fell to Rs 22 crore at 30 September 2026 from Rs 34 crore at 31 March 2026. Short-term borrowings, net of cash and liquid investments, declined to Rs 53 crore from Rs 61 crore. Current liabilities decreased to Rs 148 crore from Rs 155 crore.
Non-current liabilities increased to Rs 23 crore from Rs 17 crore over the same period. Net fixed assets, capital work in progress and right-of-use assets increased to Rs 399 crore from Rs 393 crore. The presentation reports these balance-sheet movements but does not provide operating cash flow or working-capital details.
Conclusion
Anup Engineering's Q2 FY27 sequential improvement did not reverse the H1 FY27 year-on-year decline. Revenue declined by Rs 99.9 crore, EBITDA by Rs 64.8 crore and PAT by Rs 51.1 crore, with lower revenue, fixed-cost under-absorption and a 6% raw-material-cost increase reducing reported margins.
The next points to watch are execution of the Rs 941 crore order book, conversion and delivery of thermal-power orders exceeding Rs 150 crore, and management's plan for about Rs 50 crore of technical and site-services revenue in the current year. The presentation does not disclose timing for the order book or separate margin targets for these businesses.