










Arvind Fashions lifts Q2 EBITDA margin to 13.9% as PAT rises 29.6%
Key highlights
- Arvind Fashions' Q2 FY27 EBITDA margin rose 67 bps year on year to 13.9%.
- Arvind Fashions' Q2 FY27 EBITDA increased 15.5% to Rs 216 crore on revenue of Rs 1,559 crore.
- Arvind Fashions' PAT from continuing operations increased 29.6% to Rs 49 crore in Q2 FY27.
- Arvind Fashions had 1,044 EBOs as of September 2026 after gross additions of 24 in Q2 FY27.
powered by IRIS
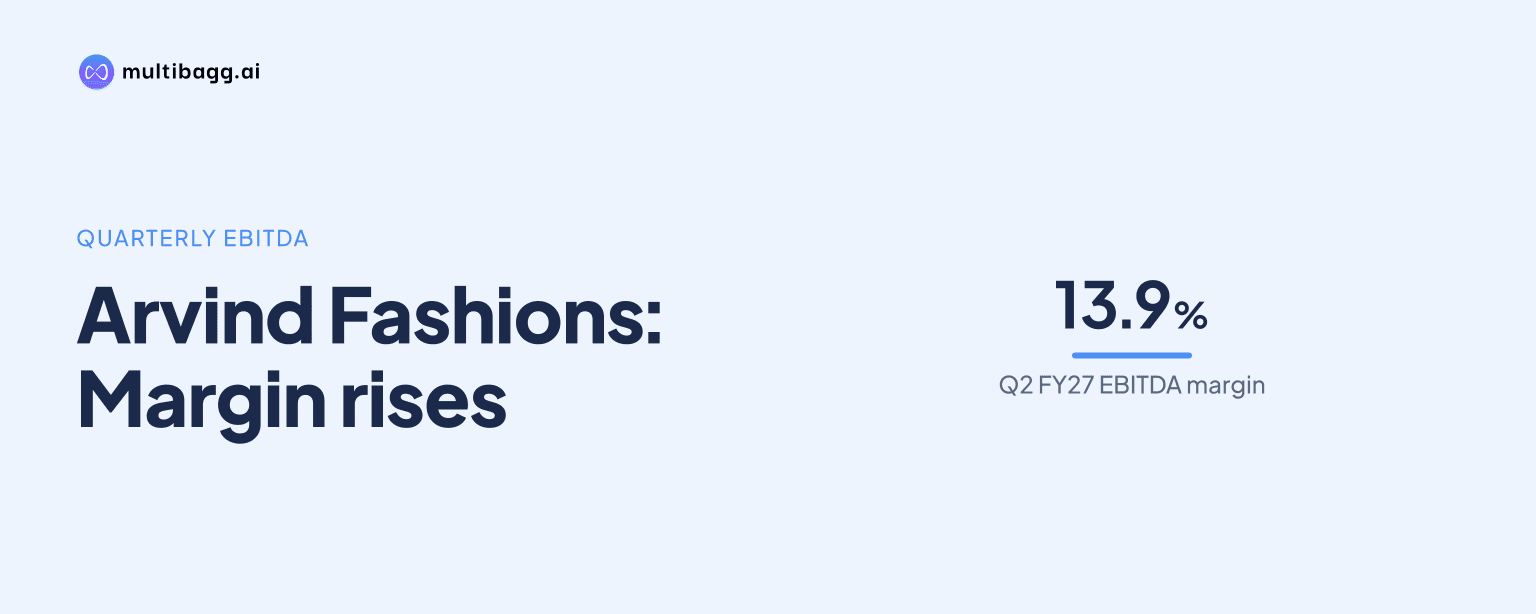
Arvind Fashions lifted its post-Ind AS Q2 FY27 earnings before interest, taxes, depreciation and amortisation (EBITDA) margin to 13.9%, from 13.2% a year earlier, as EBITDA rose 15.5% to Rs 216 crore and profit after tax (PAT) from continuing operations increased 29.6% to Rs 49 crore. Revenue grew 10.0% to Rs 1,559 crore.
Know Arvind Fashions inside out
Results, valuation, peers and who's buying, in one view.
Why did Arvind Fashions' Q2 EBITDA margin expand?
Arvind Fashions expanded its Q2 FY27 EBITDA margin by 67 basis points (bps) year on year because gross margin increased by 136 bps and channel mix improved. Arvind Fashions attributed the gross-margin movement to stronger like-to-like (LTL) retail sales, lower retail discounting and a better mix of channels.
The channel data show a greater contribution from direct formats in Q2 FY27. Retail increased to 40% of sales from 38% in Q2 FY26, while online business-to-consumer (B2C) increased to 13% from 12%. In contrast, online business-to-business (B2B) and other channels declined to 14% from 20%, while wholesale, comprising multi-brand outlets and department stores, increased to 33% from 31%.
The margin result also came with higher absolute operating profit. Post-Ind AS EBITDA excluding other income increased by Rs 29 crore, from Rs 187 crore in Q2 FY26 to Rs 216 crore in Q2 FY27, ahead of the Rs 141 crore increase in revenue. EBITDA growth of 15.5% therefore exceeded revenue growth of 10.0%.
How did Arvind Fashions' Q2 profit compare with last year?
Arvind Fashions reported Q2 FY27 PAT from continuing operations of Rs 49 crore, up from Rs 38 crore in Q2 FY26, a 29.6% increase. Profit before tax (PBT) rose by Rs 4 crore to Rs 91 crore, while taxes fell to Rs 24 crore from Rs 31 crore and non-controlling interest was unchanged at Rs 19 crore.
Reported PAT, which includes discontinued operations, was Rs 48 crore in Q2 FY27 compared with Rs 37 crore a year earlier. Discontinued operations made no contribution in either Q2 period, while the difference between continuing-operations PAT and reported PAT was Rs 1 crore in both periods.
Arvind Fashions also presented a separate pre-Ind AS snapshot, which should not be interchanged with the post-Ind AS figures. In that presentation, Q2 FY27 revenue was Rs 1,559 crore, EBITDA excluding other income was Rs 144 crore versus Rs 122 crore, and the EBITDA margin was 9.2% versus 8.6%. The pre-Ind AS snapshot showed reported PAT of Rs 55 crore against Rs 40 crore and a PAT margin of 3.6% against 2.8%.
Got a follow-up? Ask IRIS
Which sales channels supported Arvind Fashions' profitability?
Arvind Fashions' direct channels led sales growth, with retail revenue rising 15.4% and online B2C revenue growing about 28% year on year in Q2 FY27. Retail LTL growth was 7.3%, and management said it would be 10% after adjusting for the festive shift. Arvind Fashions reported mid-single-digit consumer-sales growth in wholesale channels and also cited the festive shift.
Store additions supported retail growth during the quarter. Arvind Fashions made gross additions of 24 exclusive brand outlets (EBOs), added about 26,000 net square feet and had 1,044 EBOs as of September 2026. Adjacent categories grew 13%, providing another stated sales driver alongside direct-channel expansion.
Brand disclosures showed differing direct-channel trends across the portfolio. U.S. Polo Assn. recorded direct-channel growth of more than 25% and double-digit LTL growth, while Arrow's online B2C business grew more than 35%. Flying Machine said direct-channel contribution improved by more than 3%, and Calvin Klein reported mid-double-digit LTL growth after adjustment for the festive shift, alongside more than 20% growth in premium CKU innerwear.
What changed in Arvind Fashions' working capital during the quarter?
Arvind Fashions held net working capital (NWC) days at 65 as of September 2026, unchanged from June 2026 but above 60 days in September 2025. Inventory days increased to 108 from 105 in June and 96 a year earlier, which Arvind Fashions linked to the higher share of direct channels. Inventory stood at Rs 1,828 crore, up from Rs 1,644 crore in June.
Receivable days improved to 49 in September 2026 from 52 in June and 56 in September 2025, while payable days were 92 compared with 93 and 91, respectively. NWC was Rs 1,088 crore in September 2026, up from Rs 1,016 crore in June and Rs 961 crore a year earlier. Arvind Fashions reported inventory turns of about 3.4 times alongside NWC days of 65.
On the balance sheet, borrowings were Rs 690 crore on September 30, 2026, compared with Rs 531 crore on March 31, 2026. Capital employed increased to Rs 1,921 crore from Rs 1,692 crore over the same interval, while net fixed assets rose to Rs 411 crore from Rs 361 crore. Net worth was Rs 1,231 crore on September 30, 2026, compared with Rs 1,161 crore at March 31, 2026.
Conclusion
Arvind Fashions' Q2 FY27 results show operating profit and continuing-operations PAT rising faster than revenue: EBITDA increased 15.5% to Rs 216 crore, revenue rose 10.0% to Rs 1,559 crore, and EBITDA margin reached 13.9%. Arvind Fashions attributed the improvement to a 136-bps gross-margin gain, lower retail discounting and channel mix, with retail and online B2C representing 53% combined, up from 50%.
Management's FY27 objectives include 12% to 15% revenue growth, a 100-bps to 200-bps increase in direct-channel share, and about 150 gross store openings, largely through the franchise-owned, franchise-operated route. The disclosed measures to watch are whether NWC days remain near 65 as inventory days were 108 in September 2026, and whether the planned operating leverage produces further EBITDA and PAT margin expansion.