










Astra Microwave Products Ltd EBITDA Margin Reaches 28% in FY26
Key highlights
- AMP’s standalone EBITDA margin increased to 28.0% in FY26 from 11.8% in FY22.
- AMP’s standalone revenue rose to Rs 1,156 crore in FY26 from Rs 735 crore in FY22.
- AMP’s gross-profit margin expanded to 49.1% in FY26 from 28.7% in FY22.
- AMP’s standalone PAT reached Rs 178 crore in FY26, compared with Rs 143 crore in FY25.
powered by IRIS
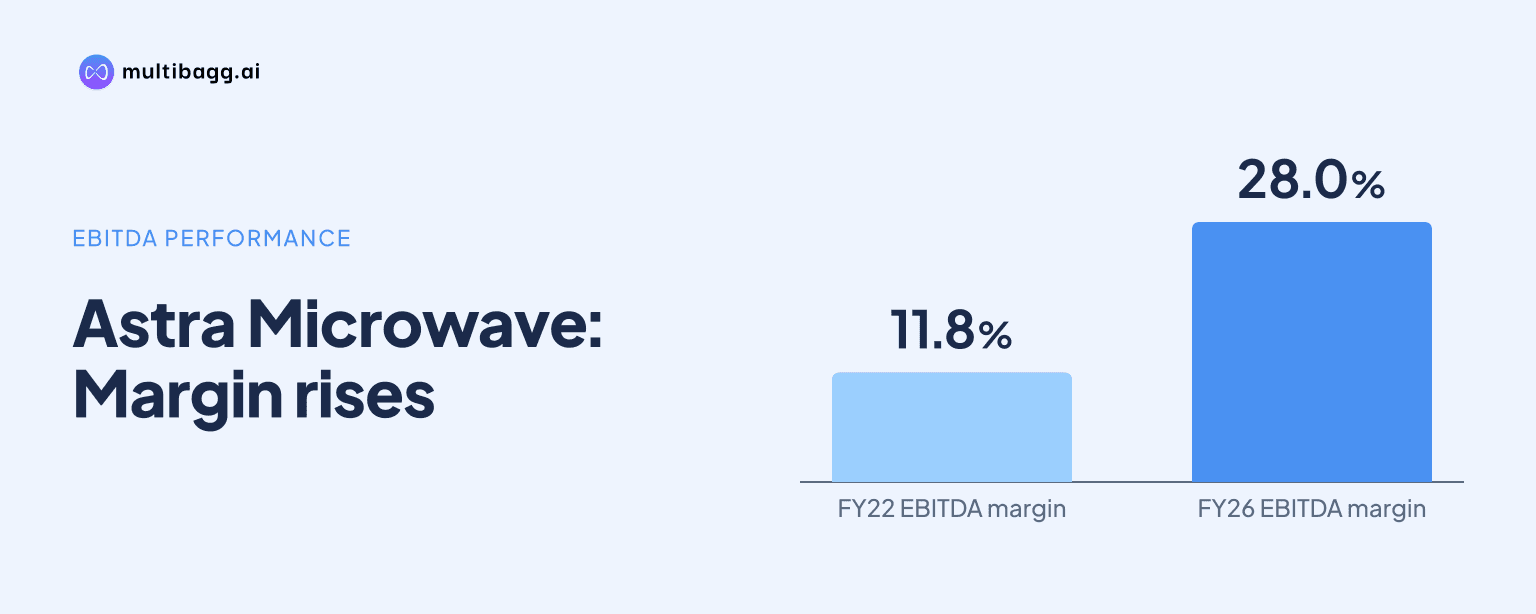
Astra Microwave Products Ltd (AMP) reported a standalone EBITDA margin of 28.0% in FY26, up from 11.8% in FY22, while revenue from operations increased to Rs 1,156 crore from Rs 735 crore. The five-year series records higher gross profit, EBITDA, earnings before interest and tax, and profit after tax in every reported year.
Know Astra Microwave Products inside out
Results, valuation, peers and who's buying, in one view.
How did AMP’s EBITDA margin reach 28%?
AMP’s standalone earnings before interest, tax, depreciation and amortisation (EBITDA) margin reached 28.0% in FY26, an increase of 16.2 percentage points from 11.8% in FY22. Standalone EBITDA rose to Rs 324 crore from Rs 87 crore over the period, while revenue from operations increased by Rs 421 crore to Rs 1,156 crore.
The improvement occurred in each intervening financial year: EBITDA margin was 18.5% in FY23, 21.4% in FY24 and 25.5% in FY25. In FY26, revenue increased by Rs 112 crore from Rs 1,044 crore in FY25 and EBITDA rose by Rs 58 crore from Rs 266 crore, adding 2.5 percentage points to the margin.
AMP’s FY26 standalone EBITDA margin was below its consolidated margin of 28.7% for the same year. Consolidated EBITDA was Rs 334 crore on revenue of Rs 1,163 crore, compared with standalone EBITDA of Rs 324 crore on revenue of Rs 1,156 crore.
What changed in AMP’s gross-profit structure?
AMP’s standalone gross-profit margin increased to 49.1% in FY26 from 28.7% in FY22, a 20.4-percentage-point expansion. Gross profit rose to Rs 568 crore from Rs 211 crore, while total raw-material cost increased to Rs 588 crore from Rs 524 crore and revenue rose to Rs 1,156 crore from Rs 735 crore.
The FY26 movement was particularly marked in the reported figures. Revenue rose by Rs 112 crore from FY25, whereas total raw-material cost rose by Rs 2 crore to Rs 588 crore. Gross profit therefore increased by Rs 110 crore from Rs 458 crore, and gross-profit margin rose from 43.9% to 49.1%.
Employee expenses rose to Rs 154 crore in FY26 from Rs 73 crore in FY22, and other expenses increased to Rs 90 crore from Rs 51 crore. Even after those two expense lines, EBITDA increased to Rs 324 crore in FY26 from Rs 87 crore in FY22; the presentation does not state an operational, product or pricing reason for the gross-margin change.
How did AMP’s operating and net profitability change?
AMP’s standalone earnings before interest and tax (EBIT) margin rose to 25.9% in FY26 from 9.9% in FY22, while profit after tax (PAT) margin increased to 15.4% from 5.5%. EBIT rose to Rs 300 crore from Rs 73 crore, and PAT increased to Rs 178 crore from Rs 40 crore across the five-year series.
In FY26, EBIT increased by Rs 50 crore from Rs 250 crore in FY25, despite depreciation rising to Rs 43 crore from Rs 35 crore. Finance cost declined by Rs 1 crore to Rs 55 crore, while profit before tax increased to Rs 245 crore from Rs 193 crore and tax rose to Rs 67 crore from Rs 50 crore.
PAT rose by Rs 35 crore in FY26 from Rs 143 crore in FY25, and PAT margin increased by 1.7 percentage points from 13.7%. Earnings per share were Rs 18.73 in FY26, compared with Rs 15.10 in FY25 and Rs 4.65 in FY22; consolidated PAT for FY26 was Rs 193 crore against standalone PAT of Rs 178 crore.
Got a follow-up? Ask IRIS
What balance-sheet movements accompanied AMP’s FY26 result?
AMP’s standalone total assets increased to Rs 1,961 crore at March 2026 from Rs 1,833 crore at March 2025. Cash and cash equivalents increased to Rs 165 crore from Rs 21 crore, while trade receivables declined to Rs 687 crore from Rs 783 crore and inventories were nearly unchanged at Rs 609 crore from Rs 608 crore.
Property, plant and equipment rose to Rs 256 crore at March 2026 from Rs 221 crore a year earlier. Current borrowings fell to Rs 224 crore from Rs 379 crore, while non-current borrowings increased to Rs 63 crore from Rs 39 crore; total borrowings across these categories fell to Rs 287 crore from Rs 418 crore.
Equity attributable to AMP’s owners rose to Rs 1,272 crore at March 2026 from Rs 1,071 crore at March 2025. Current liabilities fell to Rs 516 crore from Rs 636 crore, while non-current liabilities increased to Rs 154 crore from Rs 108 crore; the presentation does not link these balance-sheet movements to the FY26 margin outcome.
What should readers monitor after AMP’s FY26 margin expansion?
AMP’s next reported results can be compared with the FY26 relationship among Rs 1,156 crore of revenue, Rs 588 crore of raw-material cost and Rs 568 crore of gross profit. These figures produced a 49.1% gross-profit margin and supported a 28.0% standalone EBITDA margin in FY26.
Working-capital measures also changed during FY26, with trade receivables declining by Rs 96 crore to Rs 687 crore and cash and cash equivalents rising by Rs 144 crore to Rs 165 crore. Inventories increased by Rs 1 crore to Rs 609 crore, while current borrowings declined by Rs 155 crore to Rs 224 crore.
AMP’s supplied presentation contains no FY27 revenue target, EBITDA-margin target, stated capital-allocation plan or scheduled financial event. It also does not identify the reason for the FY22-to-FY26 gross-margin expansion, leaving subsequent disclosures to establish whether the reported cost and revenue relationship persists.
Conclusion
AMP’s standalone financial series shows that EBITDA margin rose from 11.8% in FY22 to 28.0% in FY26 as revenue increased by Rs 421 crore to Rs 1,156 crore. Gross-profit margin rose from 28.7% to 49.1%, while EBIT margin increased from 9.9% to 25.9% and PAT margin from 5.5% to 15.4%.
The next disclosed results should be assessed against the FY26 base of Rs 324 crore of EBITDA, Rs 178 crore of PAT and Rs 287 crore of total borrowings. AMP has not disclosed a FY27 target, a margin plan or an explanation for the margin expansion in the supplied presentation, so those unresolved matters remain central to tracking the trend.