










Astra Microwave Products Ltd. posts Rs 146 crore operating outflow
Key highlights
- AMP reported negative Rs 146 crore of standalone operating cash flow in Sep-26, versus a Rs 236 crore inflow in Sep-25.
- Changes in working capital moved to a Rs 192 crore outflow in Sep-26 from a Rs 216 crore inflow in Sep-25.
- AMP's standalone inventory increased by Rs 184 crore to Rs 793 crore between Mar-26 and Sep-26.
- AMP's standalone current borrowings rose by Rs 187 crore to Rs 411 crore at Sep-26.
powered by IRIS
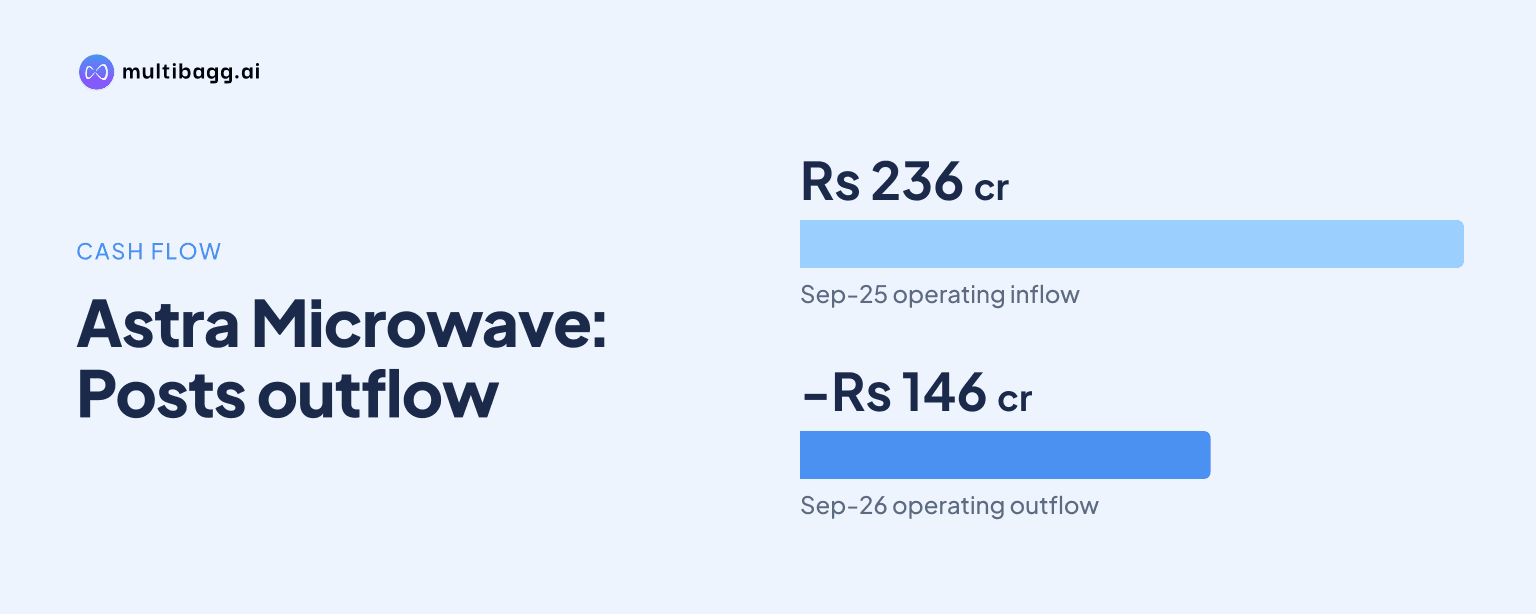
Astra Microwave Products Ltd. reported negative Rs 146 crore of standalone net cash from operating activities in Sep-26, compared with a Rs 236 crore inflow in Sep-25, after working capital absorbed Rs 192 crore. AMP reported H1FY27 standalone profit after tax of Rs 57 crore, up from Rs 34 crore a year earlier.
Know Astra Microwave Products inside out
Results, valuation, peers and who's buying, in one view.
Why did AMP report negative operating cash flow in Sep-26?
AMP reported negative operating cash flow because changes in working capital absorbed Rs 192 crore in Sep-26, compared with a Rs 216 crore source of cash in Sep-25. The reversal was larger than the Rs 30 crore increase in standalone profit before tax, which reached Rs 76 crore from Rs 46 crore. Cash generated from operations consequently moved to negative Rs 116 crore from positive Rs 262 crore.
Net direct taxes paid were Rs 30 crore in Sep-26, compared with Rs 25 crore in Sep-25. This reduced net cash from operating activities to negative Rs 146 crore, a Rs 382 crore year-on-year reversal from a Rs 236 crore inflow. The cash-flow statement is standalone, as is the H1FY27 profit and loss account reporting revenue from operations of Rs 437 crore.
The cash-flow reversal occurred alongside higher reported earnings. H1FY27 earnings before interest, tax, depreciation and amortisation, or EBITDA, rose 41.5% year on year to Rs 120 crore, while profit after tax rose 68.3% to Rs 57 crore. The presentation identifies the working-capital line, rather than lower operating profit, as the item that moved operating cash flow into an outflow.
Which balance-sheet items changed alongside AMP’s working-capital outflow?
The presentation does not provide a line-by-line reconciliation of the Rs 192 crore working-capital movement, but standalone inventory increased by Rs 184 crore to Rs 793 crore at Sep-26 from Rs 609 crore at Mar-26. Other current assets rose by Rs 41 crore to Rs 103 crore, while total current assets increased by Rs 177 crore to Rs 1,778 crore over the six months.
Trade receivables declined by Rs 12 crore to Rs 675 crore at Sep-26 from Rs 687 crore at Mar-26. Inventory’s Rs 184 crore increase exceeded the Rs 177 crore total increase in current assets because cash and cash equivalents declined by Rs 43 crore to Rs 122 crore. These period-end balances coincided with the first-half working-capital outflow, but AMP does not assign a cash-flow amount to each balance-sheet item.
AMP’s annual operating metrics improved in FY26 relative to FY25. Inventory days declined to 193 from 213, debtors days declined to 216 from 273, and creditor days increased to 36 from 27. The cash conversion cycle, measuring the time between cash paid for inputs and cash received from customers, shortened to 374 days from 459 days, although it remained above FY24’s 371 days.
The FY26 days measures and the Sep-26 inventory balance cover different reporting points. The presentation reports inventory of Rs 793 crore at Sep-26 and inventory days of 193 for FY26, without providing a comparable Sep-26 inventory-days figure. It also does not disclose a working-capital reduction target or forecast.
Got a follow-up? Ask IRIS
How did AMP cover its Sep-26 cash deficit?
AMP recorded Rs 114 crore of net cash from financing activities in Sep-26, against negative Rs 144 crore in Sep-25. Standalone current borrowings increased by Rs 187 crore to Rs 411 crore at Sep-26 from Rs 224 crore at Mar-26, while non-current borrowings increased by Rs 10 crore to Rs 73 crore.
Current liabilities rose by Rs 183 crore to Rs 699 crore between Mar-26 and Sep-26. Trade payables increased by Rs 7 crore to Rs 123 crore and contract liabilities increased by Rs 20 crore to Rs 116 crore, while other current liabilities declined by Rs 16 crore to Rs 12 crore. These are balance-sheet movements; the cash-flow statement reports the aggregate financing inflow of Rs 114 crore.
Investing activities used Rs 57 crore in Sep-26, compared with Rs 17 crore in Sep-25. Capital work in progress increased to Rs 24 crore from Rs 9 crore, and intangible assets under development rose to Rs 27 crore from nil. AMP does not allocate the investing cash outflow among individual projects or balance-sheet lines.
After operating, investing and financing flows, AMP reported a Rs 89 crore net decrease in cash and cash equivalents in Sep-26, compared with a Rs 76 crore increase in Sep-25. The cash-flow statement records opening cash and cash equivalents of Rs 116 crore and closing cash and cash equivalents of Rs 27 crore. The standalone balance sheet separately reports Rs 122 crore of current cash and cash equivalents and Rs 83 crore of bank balances other than cash equivalents at Sep-26.
Did AMP’s profit growth continue despite the cash outflow?
AMP’s standalone H1FY27 revenue from operations increased 6.6% year on year to Rs 437 crore, EBITDA increased 41.5% to Rs 120 crore, and profit after tax increased 68.3% to Rs 57 crore. EBITDA margin expanded to 27.4% from 20.6%, while profit-after-tax margin increased to 13.0% from 8.2%.
The second quarter accounted for a substantial part of the first-half improvement. Q2FY27 standalone revenue was Rs 261 crore, up 22.5% from Rs 213 crore in Q2FY26, while EBITDA rose 87.4% to Rs 87 crore from Rs 46 crore. Q2FY27 profit after tax was Rs 47 crore, compared with Rs 21 crore a year earlier.
Consolidated figures show a similar difference between earnings and cash conversion. Consolidated net cash from operating activities was negative Rs 148 crore in Sep-26, versus a Rs 238 crore inflow in Sep-25, after a Rs 200 crore working-capital outflow. Consolidated H1FY27 profit after tax nevertheless rose 60.2% to Rs 64 crore from Rs 40 crore.
Consolidated inventory increased by Rs 191 crore to Rs 807 crore at Sep-26 from Rs 616 crore at Mar-26, while consolidated current borrowings increased by Rs 188 crore to Rs 412 crore from Rs 224 crore. The standalone and consolidated statements therefore both report rising earnings, a working-capital cash outflow and higher short-term borrowings over the period.
Conclusion
AMP’s Sep-26 standalone result shows a clear divergence between accounting profit and operating cash generation. H1FY27 profit after tax increased to Rs 57 crore and EBITDA to Rs 120 crore, but a Rs 192 crore working-capital absorption contributed to negative Rs 146 crore of operating cash flow.
The next reported period will indicate whether the Sep-26 inventory balance of Rs 793 crore and current borrowings of Rs 411 crore change as cash is generated from operations. AMP’s presentation provides FY26 cash conversion cycle data of 374 days but discloses no cash-flow forecast or working-capital reduction target, leaving the future pace of inventory conversion, collections and financing needs unresolved.