










Banswara FY26 Margin Below FY23 Despite Asset Expansion
Key highlights
- Banswara’s FY26 standalone EBITDA margin was 10.5%, versus 9.0% in FY25 and 14.1% in FY23.
- FY26 EBITDA was Rs 143.6 crore, Rs 26.4 crore above FY25 but Rs 69.1 crore below FY23.
- Property, plant and equipment increased to Rs 550.6 crore at March 2026 from Rs 362.8 crore at March 2023.
- FY26 net cash from operating activities was Rs 120.8 crore, while investing activities used Rs 98.5 crore.
powered by IRIS
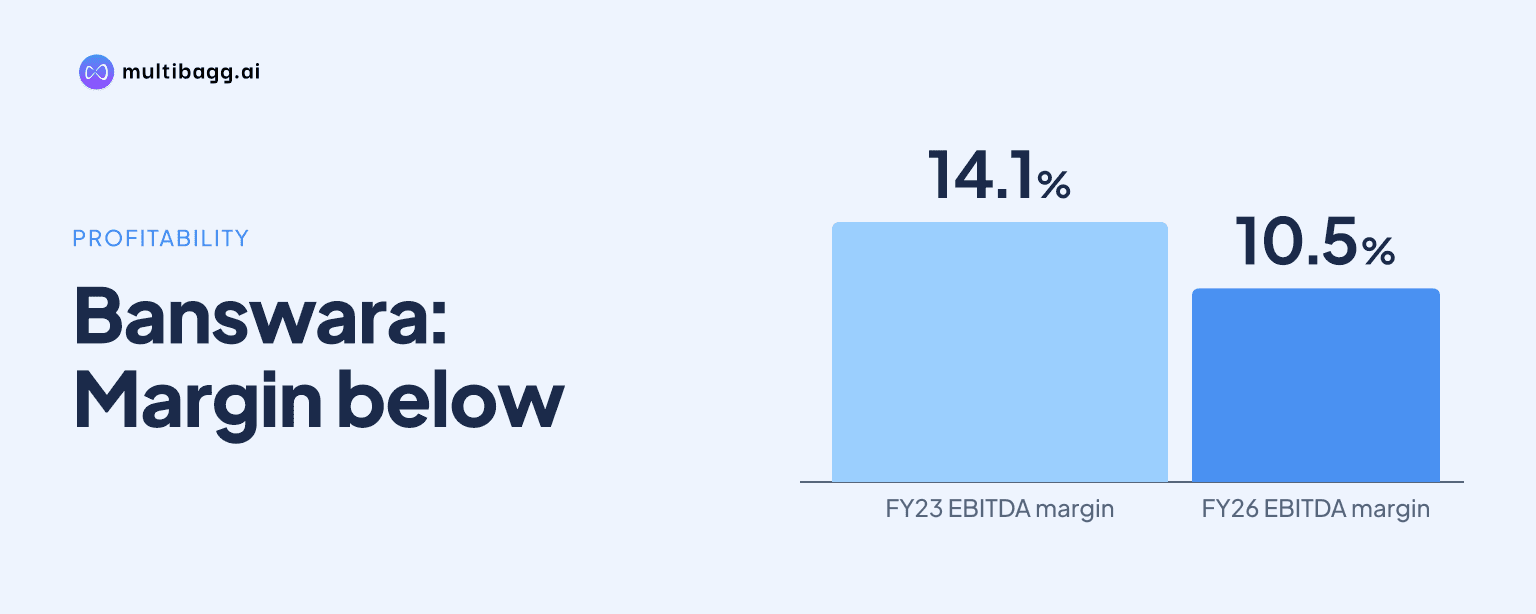
Banswara Syntex Limited reported a 10.5% standalone earnings before interest, tax, depreciation and amortisation (EBITDA) margin in FY26, improving from 9.0% in FY25 but remaining 3.6 percentage points below FY23’s 14.1%, despite property, plant and equipment rising by Rs 187.8 crore over the displayed period to Rs 550.6 crore.
Know Banswara Syntex inside out
Results, valuation, peers and who's buying, in one view.
Why did Banswara’s FY26 EBITDA margin remain below FY23?
Banswara’s FY26 EBITDA margin remained below FY23 because EBITDA was Rs 143.6 crore on revenue from operations of Rs 1,355.8 crore, compared with EBITDA of Rs 212.7 crore on revenue of Rs 1,498.8 crore in FY23. Revenue in FY26 was Rs 143.0 crore below FY23, while EBITDA was Rs 69.1 crore lower, resulting in the 10.5% margin versus 14.1%.
The cost mix also differed from FY23. Raw-material expense was Rs 572.3 crore in FY26, down from Rs 628.8 crore in FY23, and power and fuel fell to Rs 134.9 crore from Rs 192.2 crore. However, employee expense increased to Rs 320.2 crore from Rs 286.3 crore, while other expenses were Rs 198.7 crore against Rs 193.4 crore, leaving EBITDA below the earlier level.
How did Banswara’s profitability change from FY23 to FY26?
Banswara’s profitability declined after FY23 before partially recovering in FY26. EBITDA fell from Rs 212.7 crore in FY23 to Rs 120.6 crore in FY24 and Rs 117.2 crore in FY25, before rising Rs 26.4 crore to Rs 143.6 crore in FY26. The FY26 margin increased by 1.5 percentage points from FY25, but it did not return to the FY23 level.
PAT followed a similar but more uneven path, moving from Rs 111.4 crore in FY23 to Rs 35.3 crore in FY24, Rs 21.4 crore in FY25 and Rs 28.4 crore in FY26. FY26 depreciation was Rs 53.2 crore, compared with Rs 40.8 crore in FY23, and finance cost was Rs 42.6 crore against Rs 31.7 crore. Banswara also recorded an Rs 8.9 crore exceptional loss in FY26, while the prior three years showed no exceptional item.
Revenue recovered in FY26 but remained below the FY23 reference point. Revenue from operations increased Rs 64.1 crore from FY25’s Rs 1,291.7 crore to Rs 1,355.8 crore in FY26, yet was still Rs 143.0 crore below FY23. Total income was Rs 1,369.7 crore in FY26, including Rs 13.9 crore of other income, compared with Rs 1,513.4 crore in FY23, including Rs 14.6 crore of other income.
How much did Banswara expand its fixed-asset base?
Banswara expanded property, plant and equipment to Rs 550.6 crore at March 2026 from Rs 362.8 crore at March 2023, an increase of Rs 187.8 crore. Non-current assets rose to Rs 646.5 crore from Rs 444.4 crore over the same dates, while total assets increased to Rs 1,268.1 crore from Rs 1,068.5 crore.
The largest year-on-year expansion in property, plant and equipment during the displayed period occurred in March 2025, when it rose to Rs 515.3 crore from Rs 418.7 crore in March 2024. It then increased to Rs 550.6 crore in March 2026. Capital work in progress was Rs 30.2 crore at March 2026, compared with Rs 21.8 crore at March 2023.
Got a follow-up? Ask IRIS
Did Banswara’s cash generation support its investment outflows?
Banswara generated Rs 120.8 crore of net cash from operating activities in FY26, compared with Rs 79.1 crore in FY25 and Rs 20.2 crore in FY23. Net cash used in investing activities was Rs 98.5 crore in FY26, lower than Rs 139.0 crore in FY25 but close to Rs 99.5 crore in FY23. The four-year record shows investment outflows in each reported year alongside variable operating cash generation.
Working-capital movements changed the cash outcome across the period. In FY26, changes in working capital used Rs 7.3 crore, compared with an outflow of Rs 26.8 crore in FY25; in FY24, they added Rs 49.8 crore, while FY23 showed an Rs 145.2 crore outflow. Cash generated from operations consequently reached Rs 129.0 crore in FY26, versus Rs 63.6 crore in FY23 despite FY23’s higher operating profit before working-capital changes of Rs 208.8 crore.
Cash and cash equivalents ended FY26 at Rs 0.2 crore, down from Rs 3.4 crore at the end of FY25 and Rs 14.6 crore at the end of FY23. Net cash from financing activities was an outflow of Rs 25.4 crore in FY26, after an inflow of Rs 55.2 crore in FY25. On the balance sheet, current borrowings rose to Rs 279.9 crore at March 2026 from Rs 247.6 crore at March 2023, while non-current borrowings increased to Rs 193.7 crore from Rs 123.6 crore.
What actions does Banswara identify to improve margins?
Banswara identifies higher capacity utilisation, cost optimisation and a greater share of value-added products as the mechanisms intended to support margins. The company says demand has improved across the domestic and international textile value chain, that order-book visibility is high in its fabrics and garments divisions, and that it targets higher consumption of its own yarn in fabrics.
On costs, Banswara says it switched to grid power as thermal power cost increased and cites productivity per person, optimisation of travel and advertising, and plant locations intended to optimise raw-material and freight costs. The FY26 power-and-fuel expense of Rs 134.9 crore was below FY25’s Rs 136.6 crore and FY24’s Rs 147.8 crore, though the presentation does not quantify savings from the grid-power switch.
Banswara also says product mix is expected to move towards value-added products as demand shifts towards quality fabrics. This is a management-stated plan rather than a reported FY26 financial outcome. The reported margin improvement from 9.0% in FY25 to 10.5% in FY26 provides the latest comparison, but the 14.1% margin recorded in FY23 remains the higher benchmark in the four-year table.
Conclusion
Banswara’s financial record shows that the expansion of property, plant and equipment from Rs 362.8 crore in March 2023 to Rs 550.6 crore in March 2026 coincided with a recovery in FY26 EBITDA from FY25, but not with restoration of FY23 profitability. PAT was Rs 28.4 crore in FY26 against Rs 111.4 crore in FY23, while depreciation and finance cost were Rs 53.2 crore and Rs 42.6 crore respectively.
The next indicators to watch are whether management’s planned higher capacity utilisation, increased own-yarn use in fabrics and move towards value-added products lift margins beyond the FY26 level. Cash generation also remains relevant: FY26 operating cash flow was Rs 120.8 crore against an investing outflow of Rs 98.5 crore, with capital work in progress at Rs 30.2 crore and cash and cash equivalents at Rs 0.2 crore at year-end.